Overview
Introduction
The following chapter aims at giving the reader a step-by-step description of what is available on the platform and the meaning of the different tabs and entries.
When the user connects to the platform, the home page is the Dashboard. This Dashboard contains several visuals summarizing the types and quantity of data recently imported into the platform.
Dashboard
To get more information about the components of the default dashboard, you can consult the Getting started.
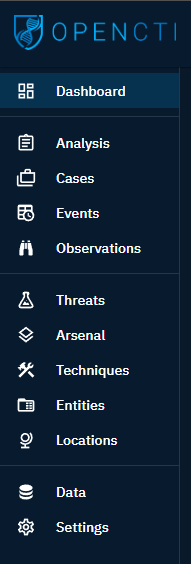
The left side panel allows the user to navigate through different windows and access different views and categories of knowledge.
Structure
The "hot knowledge"
The first part of the platform in the left menu is dedicated to what we call the "hot knowledge", which means this is the entities and relationships which are added on a daily basis in the platform and which generally require work / analysis from the users.
Analyses: all containers which convey relevant knowledge such as reports, groupings and malware analyses.Cases: all types of case like incident responses, requests for information, for takedown, etc.Events: all incidents & alerts coming from operational systems as well as sightings.Observations: all technical data in the platform such as observables, artifacts and indicators.
The "cold knowledge"
The second part of the platform in the left menu is dedicated to the "cold knowledge", which means this is the entities and relationships used in the hot knowledge. You can see this as the "encyclopedia" of all pieces of knowledge you need to get context: threats, countries, sectors, etc.
Threats: all threats entities from campaigns to threat actors, including intrusion sets.Arsenal: all tools and pieces of malware used and/or targeted by threats, including vulnerabilities.Techniques: all objects related to tactics and techniques used by threats (TTPs, etc.).Entities: all non-geographical contextual information such as sectors, events, organizations, etc.Locations: all geographical contextual information, from cities to regions, including precise positions.
Hide categories
You can customize the experience in the platform by hiding some categories in the left menu, whether globally or for a specific role.
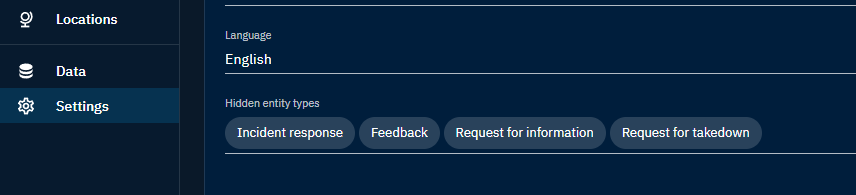
Hide categories globally
In the Settings > Parameters, it is possible for the platform administrator to hide categories in the platform for all users.
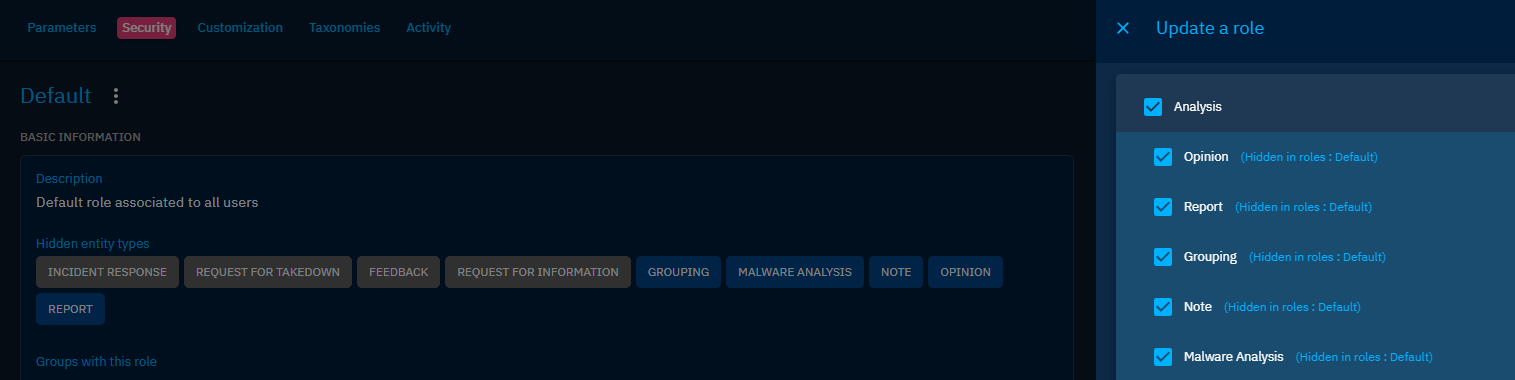
Hide categories in roles
In OpenCTI, the different roles are highly customizable. It is possible to defined default dashboards, triggers, etc. but also be able to hide categories in the roles:
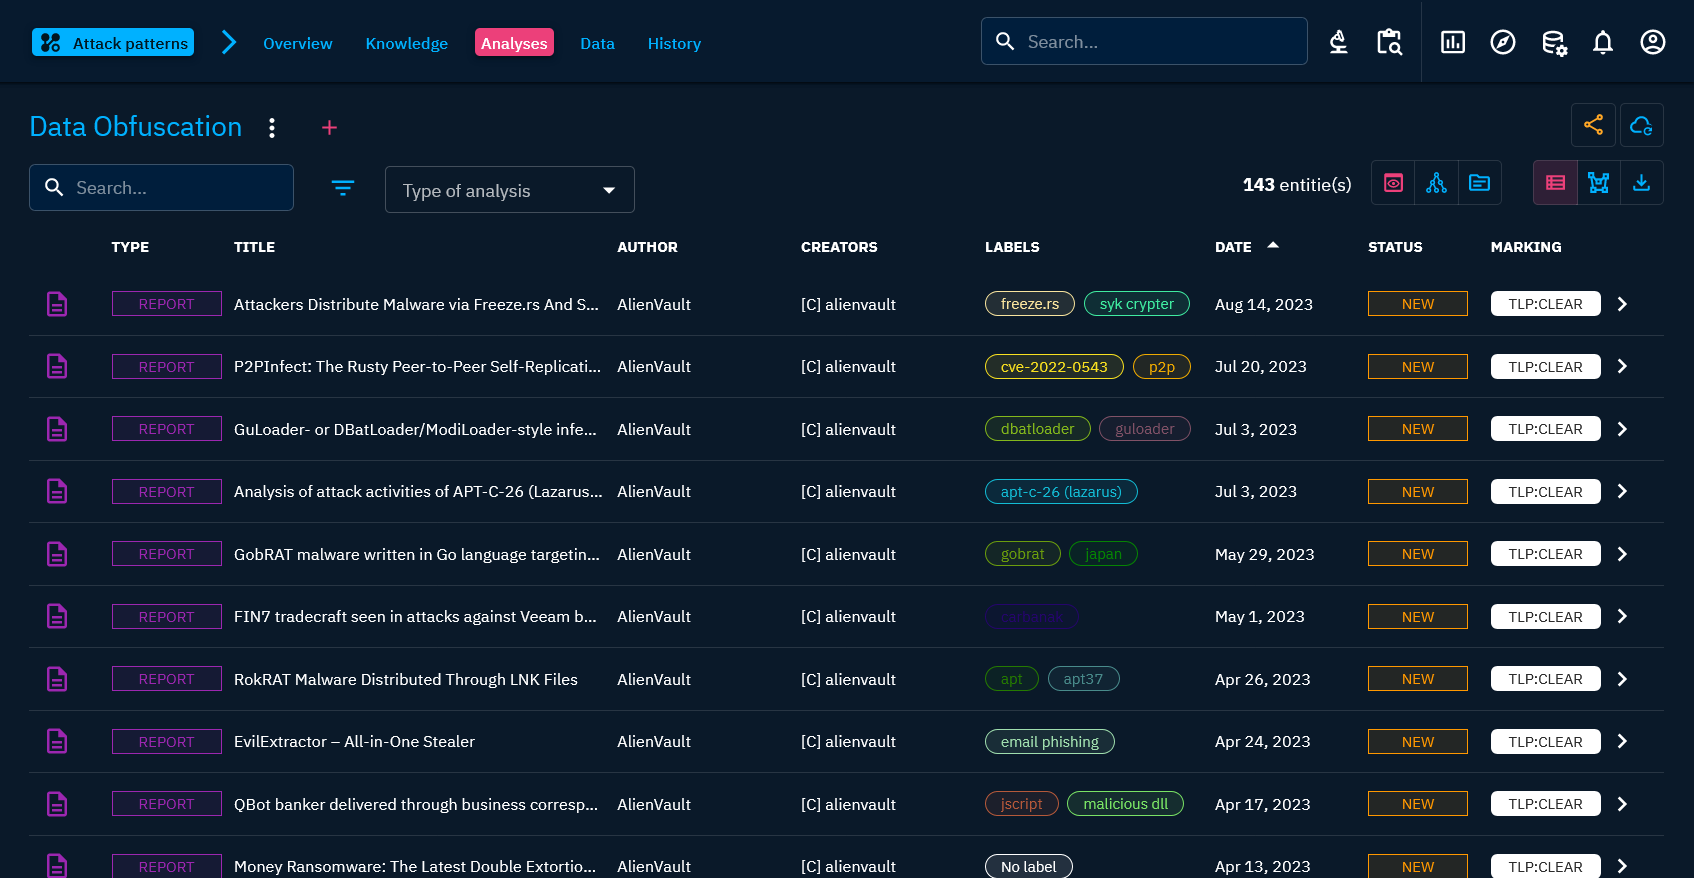
Entities lists
In each knowledge category, you can view, order, filter, modify the list of the entities of the category.
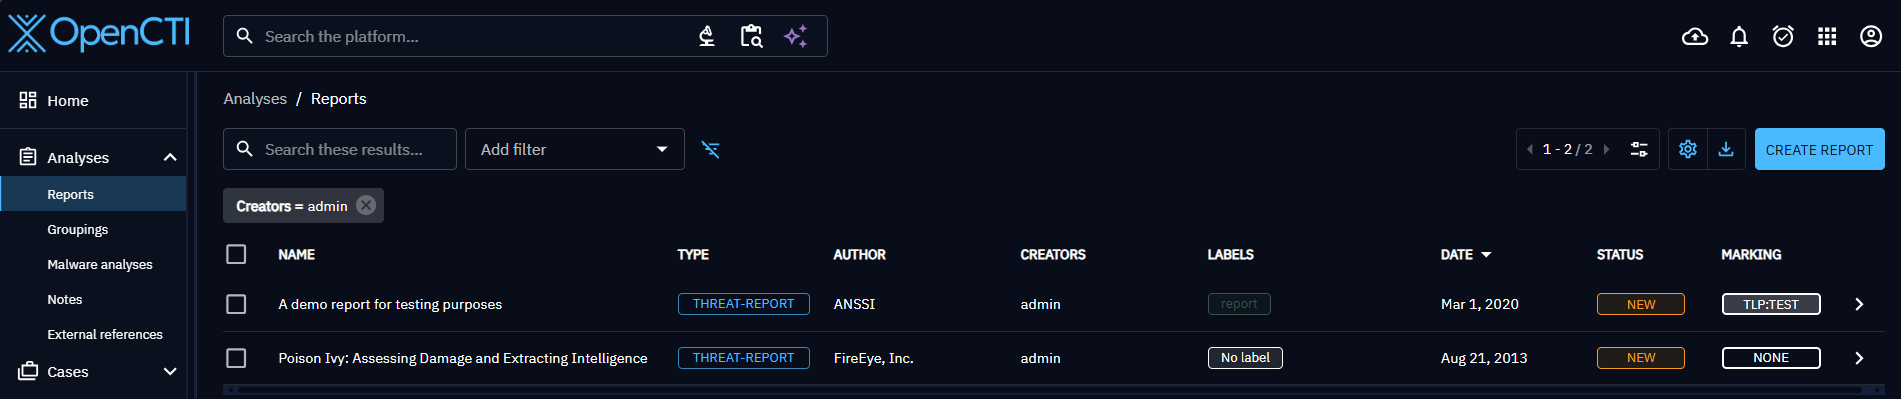
Several actions can be performed from there:
- Click on a line to display a specific entity information,
- Click on a column name to order the list by this column,
Sortable columns
Some columns are always sortable (like dates or names columns). Some are never sortable (like labels).
Some columns are only sortable if runtime mapping is enabled, i.e. if the platform is with Elastic v >= 7.12 (not working with OpenSearch for instance). It is the case for columns whose content is calculated at runtime and not stored in the database: author, creator, observable value, markings, kill chain phases, assignee, participant, place of birth, ethnicity. Indeed all those fields are not stored in the database and requires a resolution to fetch additional information useful for the sorting (like the creator name) from an id.
- Modify filters to display entities corresponding to given criteria,
- Select entities via the checkboxes to perform specific actions on them (merge, update, delete, enrich, share entities).
Presentation of a typical entity page in OpenCTI
While OpenCTI features numerous entities and tabs, many of them share similarities, with only minor differences arising from specific characteristics. These differences may involve the inclusion or exclusion of certain fields, depending on the nature of the entity.
In this part will only be detailed a general outline of a "typical" OpenCTI page. The specifies of the different entities will be detailed in the corresponding pages below (Activities and Knowledge).

Overview
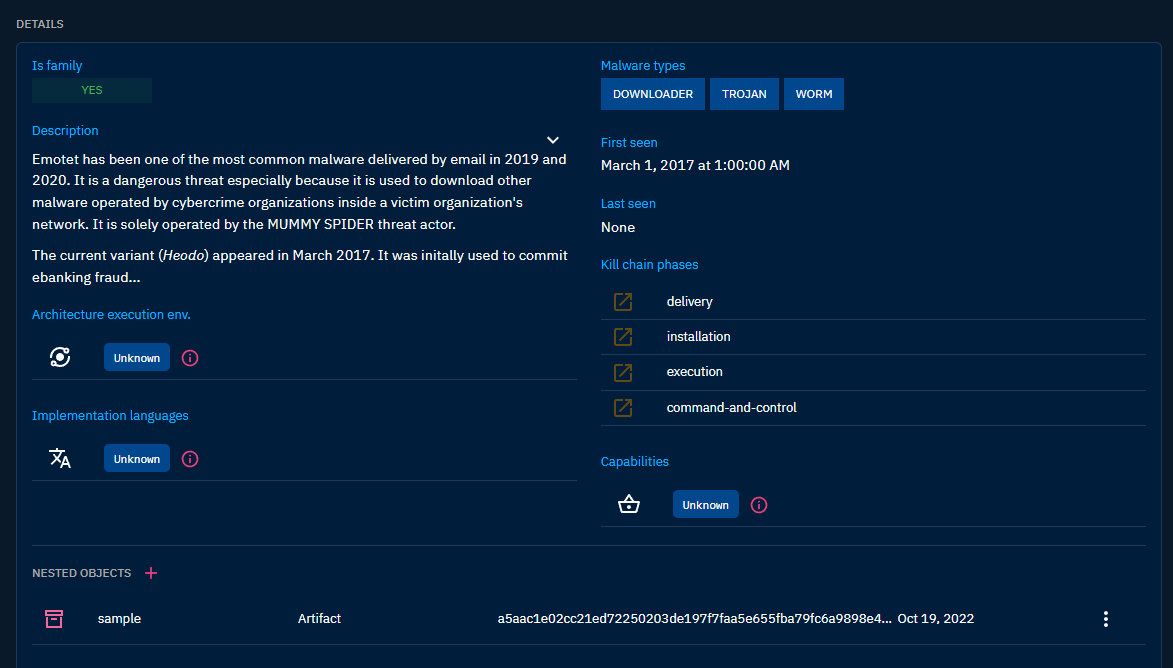
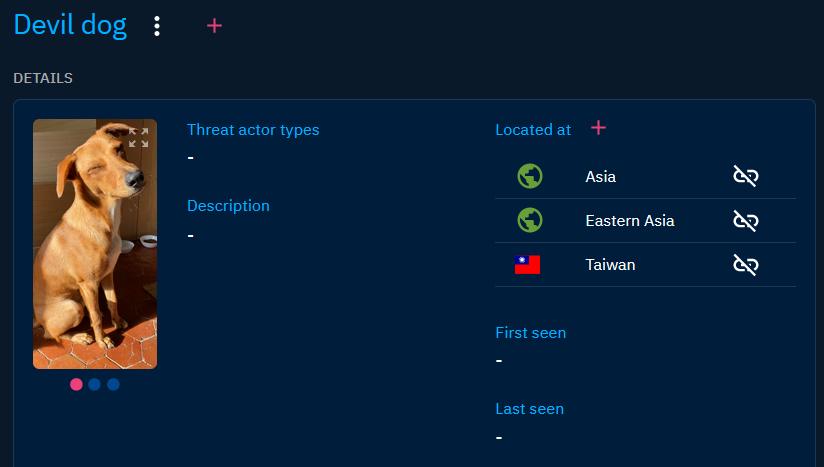
In the Overview tab on the entity, you will find all properties of the entity as well as the recent activities.
First, you will find the Details section, where are displayed all properties specific to the type of entity you are looking at, an example below with a piece of malware:
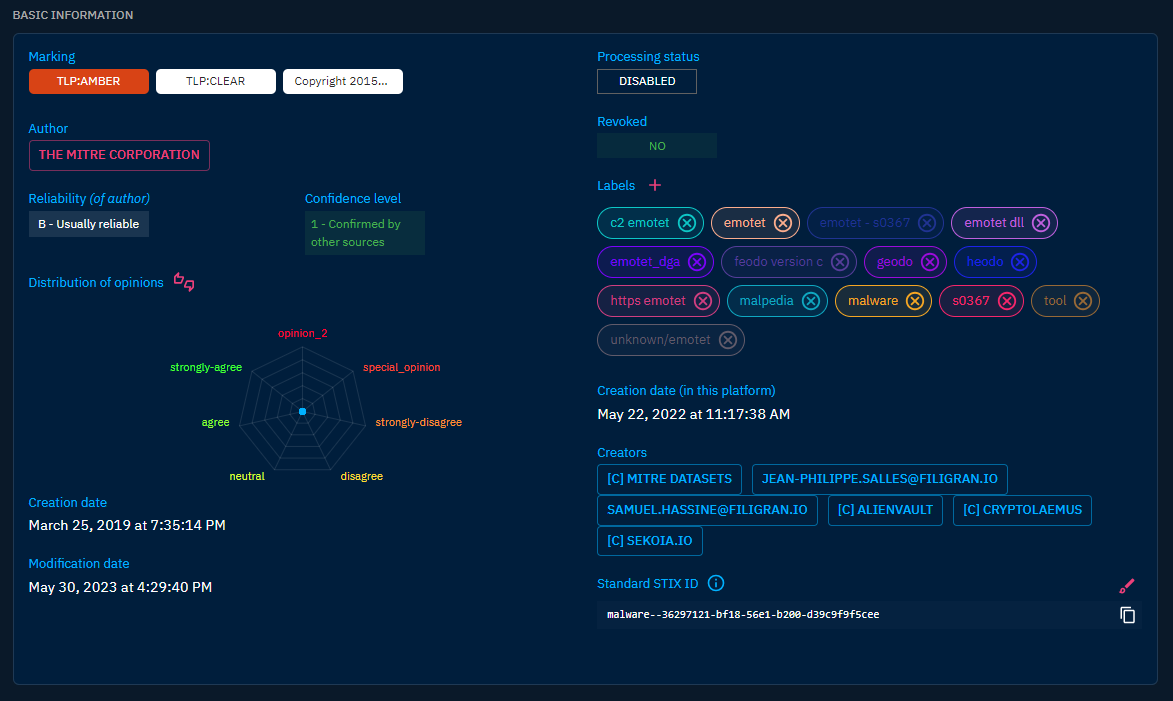
Thus, in the Basic information section, are displayed all common properties to all objects in OpenCTI, such as the marking definition, the author, the labels (i.e. tags), etc.
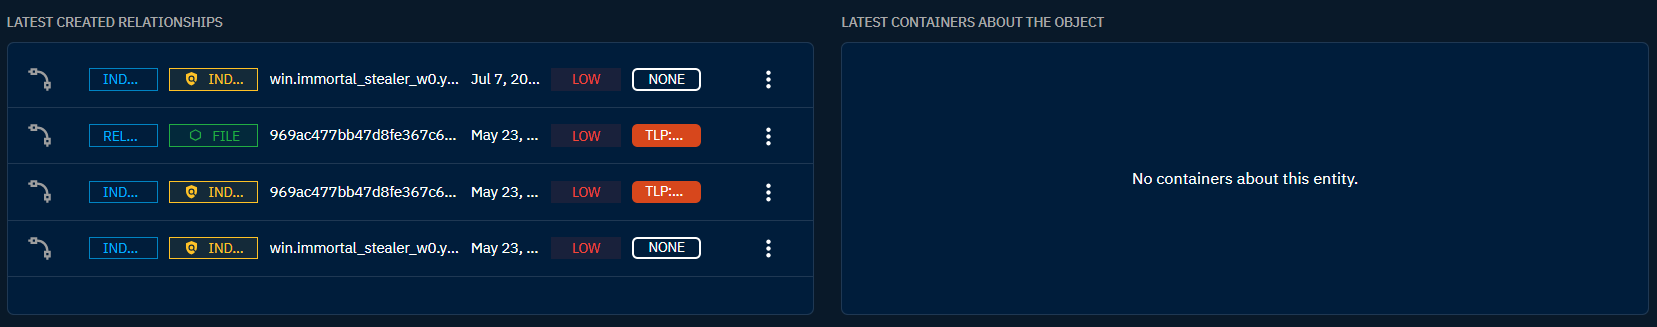
Below these two sections, you will find latest modifications in the Knowledge base related to the Entity:
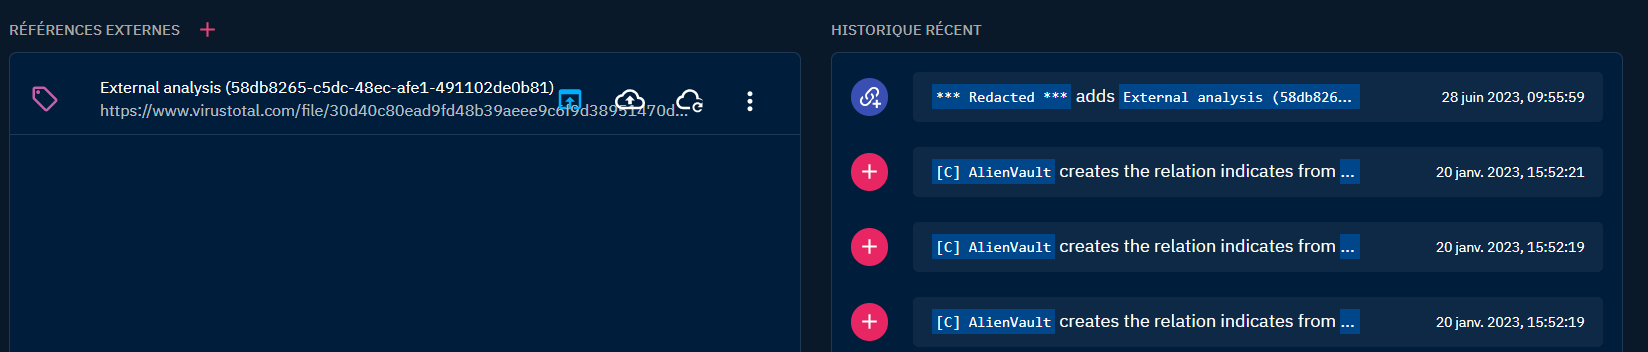
Latest created relationships: display the latest relationships that have been created from or to this Entity. For example, latest Indicators of Compromise and associated Threat Actor of a Malware.latest containers about the object: display all the Cases and Analyses that contains this Entity. For example, the latest Reports about a Malware.External references: display all the external sources associated with the Entity. You will often find here links to external reports or webpages from where Entity's information came from.History: display the latest chronological modifications of the Entity and its relationships that occurred in the platform, in order to traceback any alteration.
Last, all Notes written by users of the platform about this Entity are displayed in order to access unstructured analysis comments.
Knowledge
In the Knowledge tab, which is the central part of the entity, you will find all the Knowledge related to the current entity. The Knowledge tab is different for Analyses (Report, Groupings) and Cases (Incident response, Request for Information, Request for Takedown) entities than for all the other entity types.
- The
Knowledgetab of those entities (who represents Analyses or Cases that can contains a collection of Objects) is the place to integrate and link together entities. For more information on how to integrate information in OpenCTI using the knowledge tab of a report, please refer to the part Manual creation. - The
Knowledgetabs of any other entity (that does not aim to contain a collection of Objects) gather all the entities which have been at some point linked to the entity the user is looking at. For instance, as shown in the following capture, theKnowledgetab of Intrusion set APT29, gives access to the list of all entities APT29 is attributed to, all victims the intrusion set has targeted, all its campaigns, TTPs, malware etc. For entities to appear in these tabs underKnowledge, they need to have been linked to the entity directly or have been computed with the inference engine. - When consulting an
Incident,Infrastructure,Threat Actor (group),Threat Actor (individual),Intrusion Set,Malware,ChannelorToolentity in OpenCTI, you may consult its auto-populatedDiamondmodel from theKnowledgetab. TheDiamondmodel illustrates the relationships that exist between the viewed entity and other entities in OpenCTI and automatically maps them to one of the four relevant quadrants: Adversary (e.g. Threat Actors), Infrastructure (e.g. Observables), Victimology (e.g. Sectors) and Capabilities (e.g. Attack Patterns). Each Diamond quadrant is interactive and can be clicked on to navigate to a full list (or only a subset) of its relevant entities.
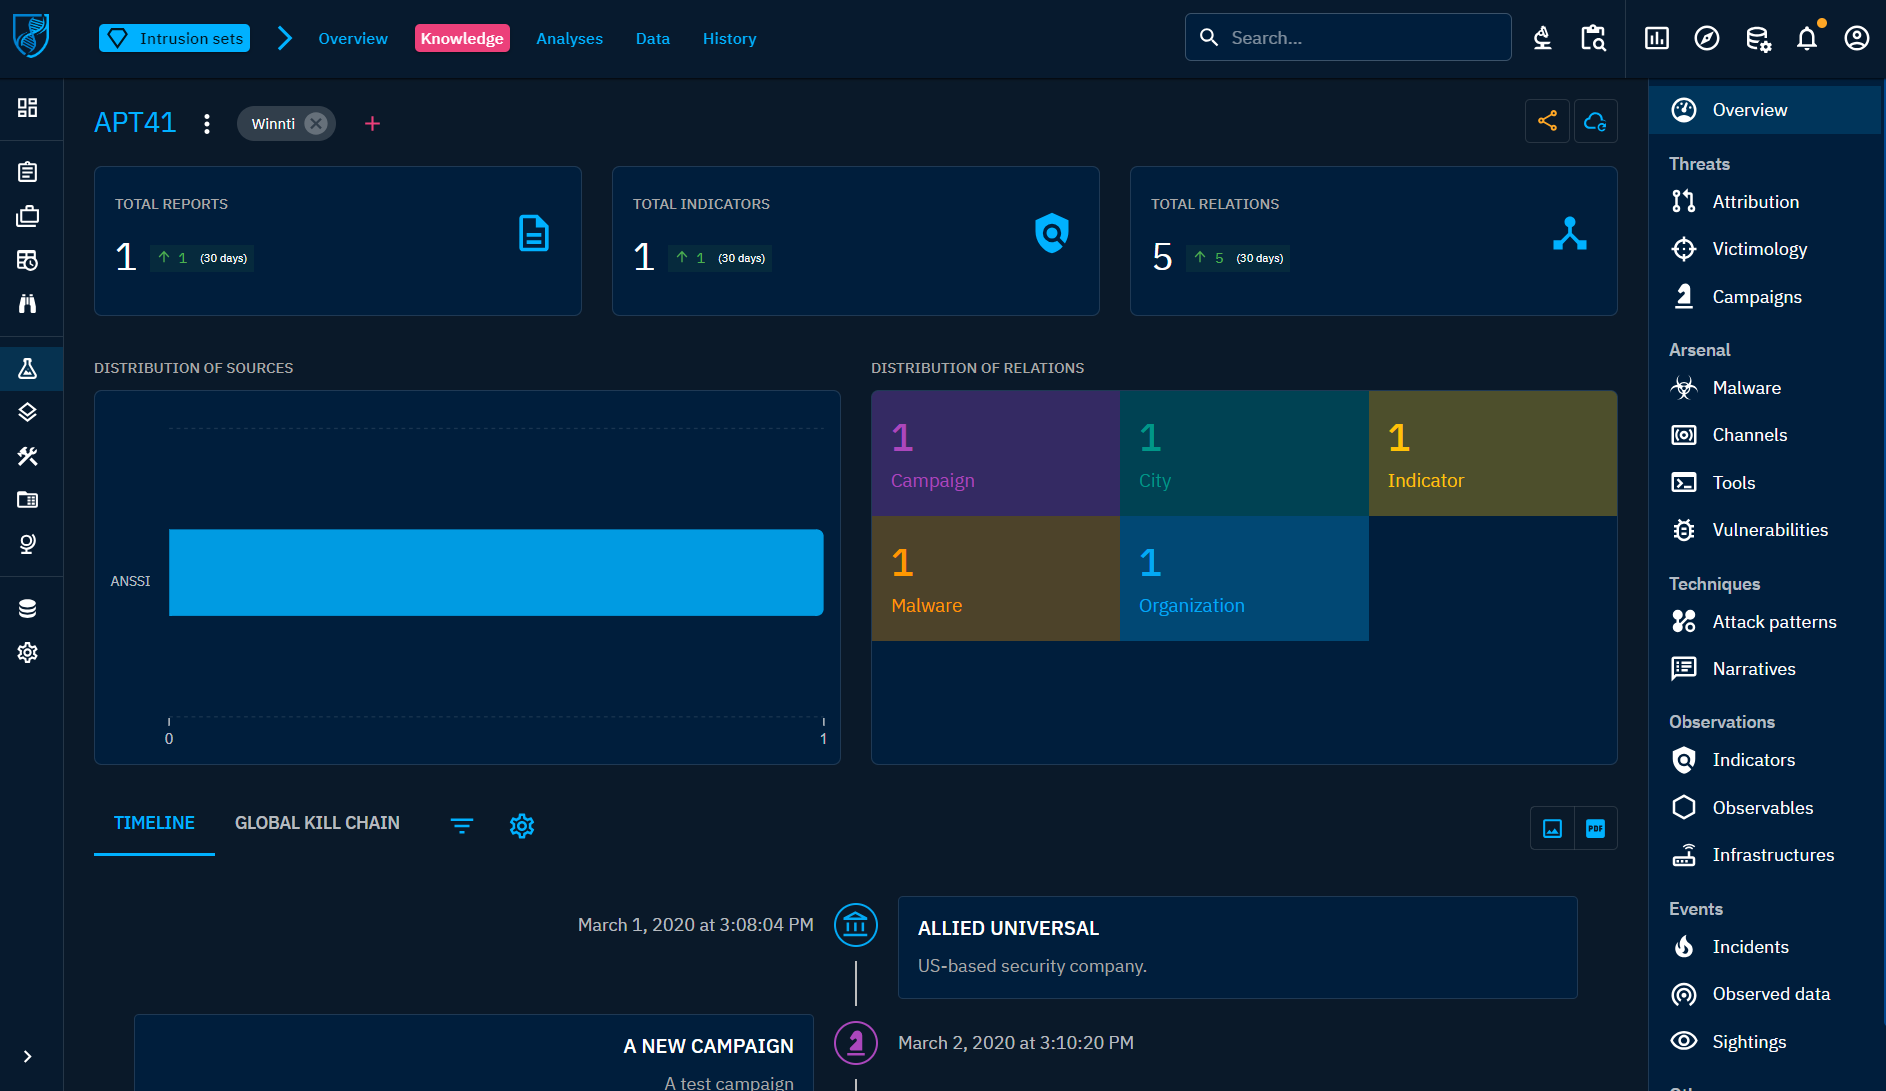
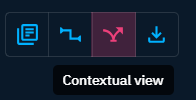
Focus on Indicators and Observables
The Indicators and Observables section offers 3 display modes:
- The entities view, which displays the indicators/observables linked to the entity.
- The relationship view, which displays the various relationships between the indicators/observables linked to the entity and the entity itself.
- The contextual view, which displays the indicators/observables contained in the cases and analyses that contain the entity.
Content
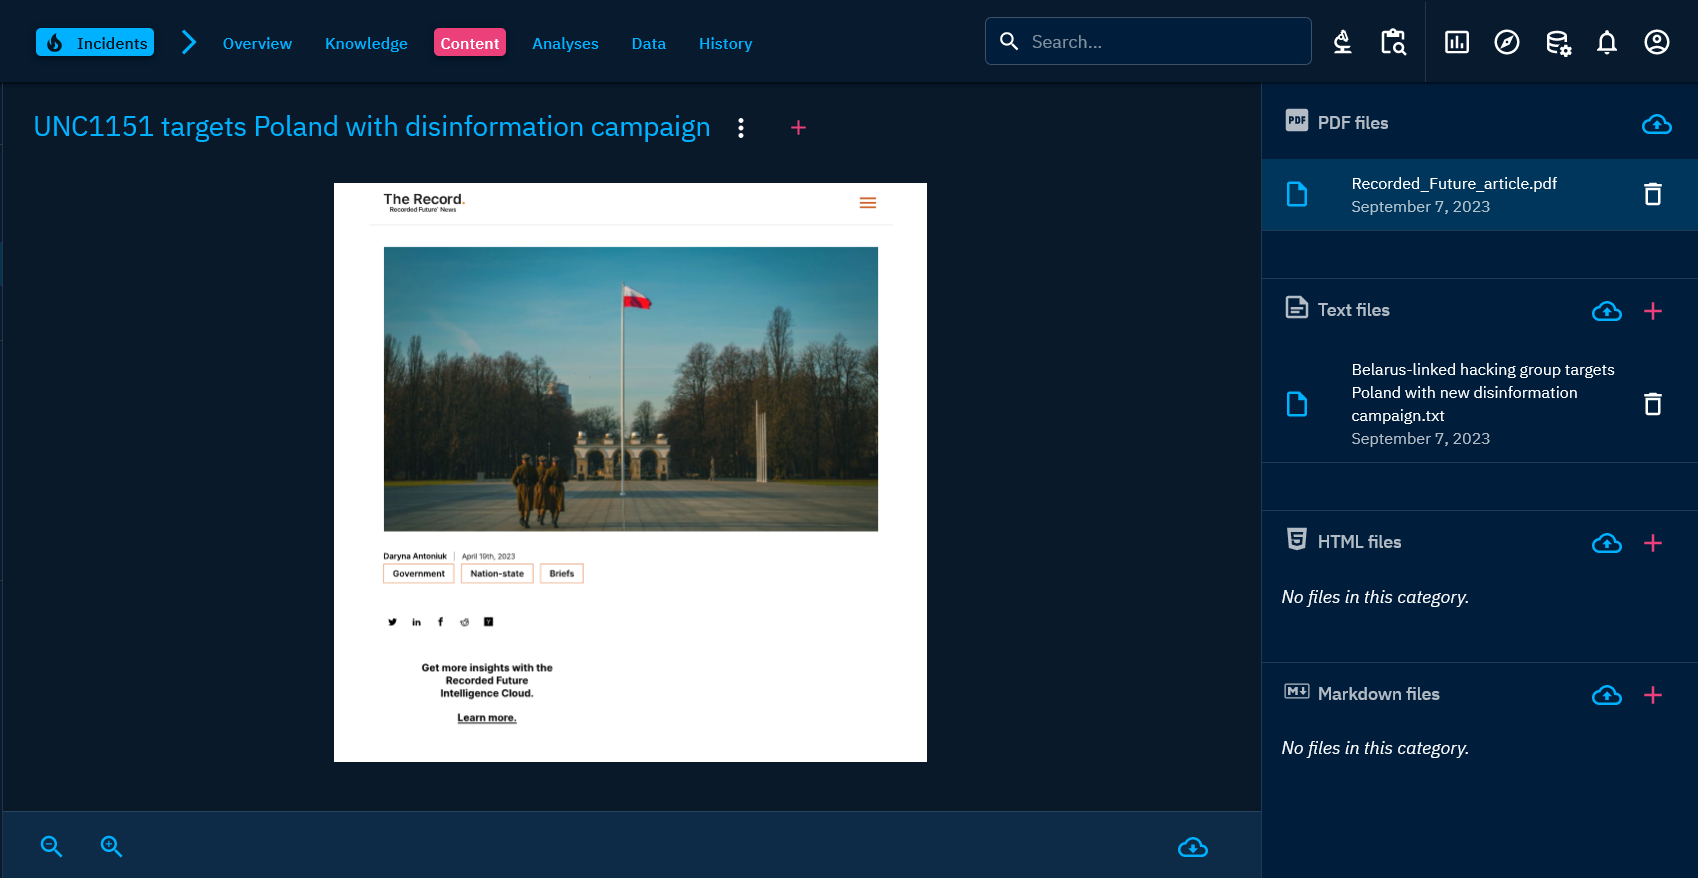
The Content tab is available for all entities. It allows for uploading and creating outcomes documents related to the content of the current entity (in PDF, text, HTML or markdown files). This specific tab enable to previzualize, manage and write deliverable associated with the entity. For example an analytic report to share with other teams, a markdown files to feed a collaborative wiki with, etc.
Markdown image upload in description
You can insert images directly in markdown editors used for descriptions and content fields.
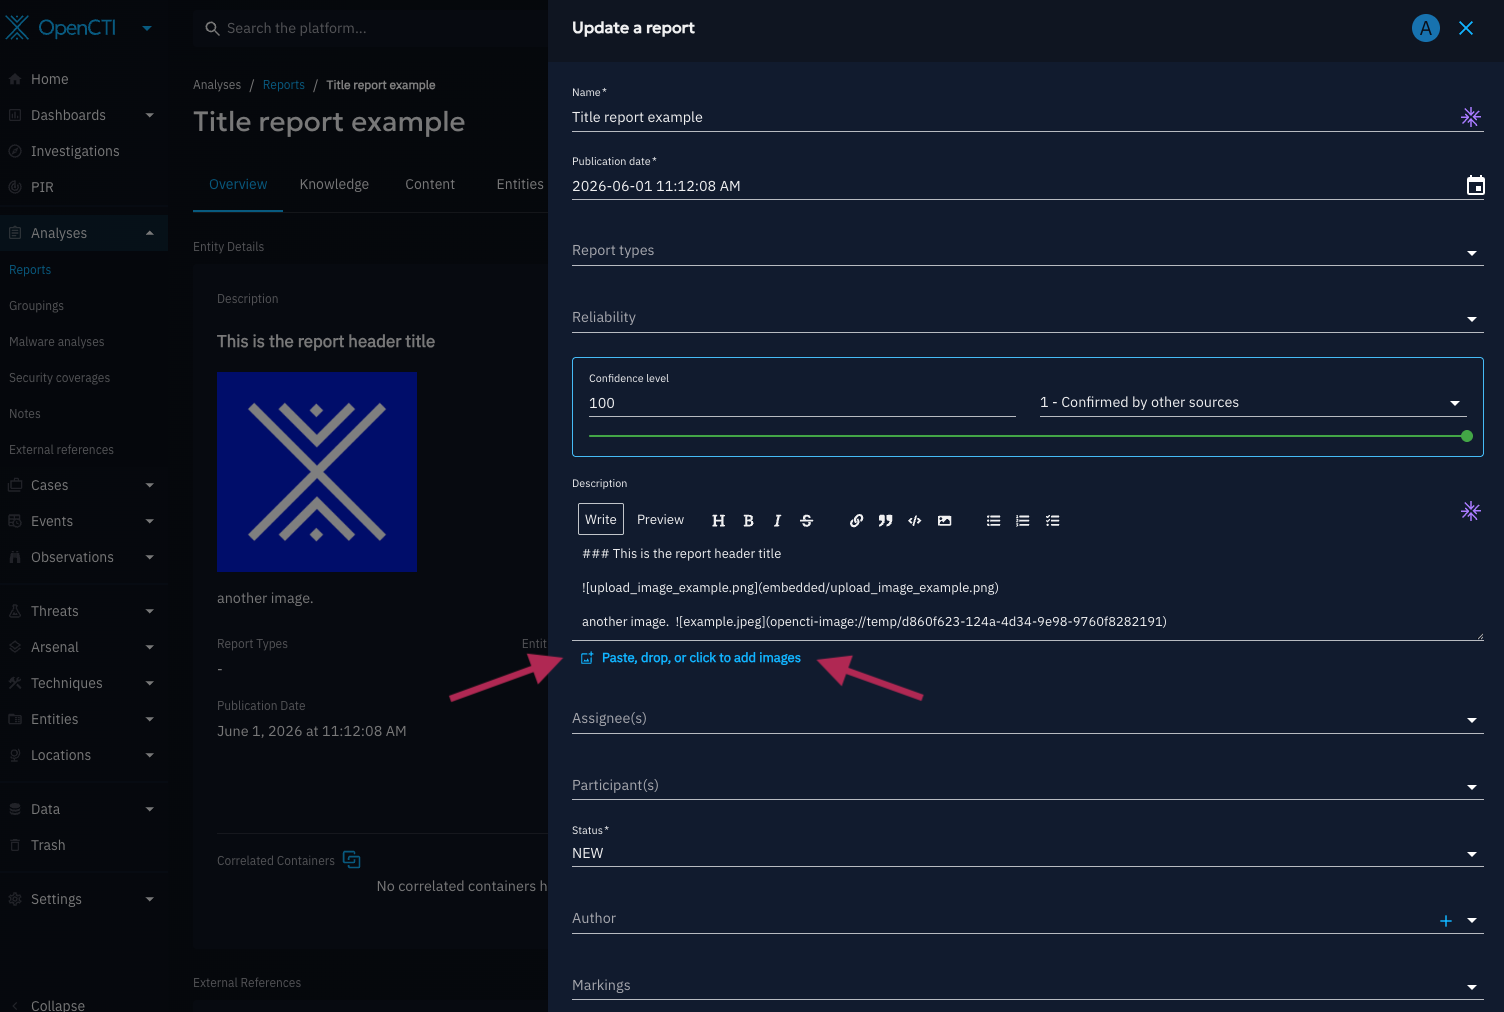
There are three supported methods:
- Copy and paste an image into the editor.
- Drag and drop an image file into the editor.
- Use the image browse/upload action from the editor toolbar.
When you paste, drop, or browse an image in Write mode, the image markdown is inserted at the current cursor position (or at the end of the content if no cursor position is available).
After insertion, the image is embedded in your markdown content and stored by the platform when you save or create the entity.
You can use the Preview tab of the editor to visualize inserted images.
When you click an image in Preview, a gallery viewer opens so you can browse all images embedded in the markdown more easily.
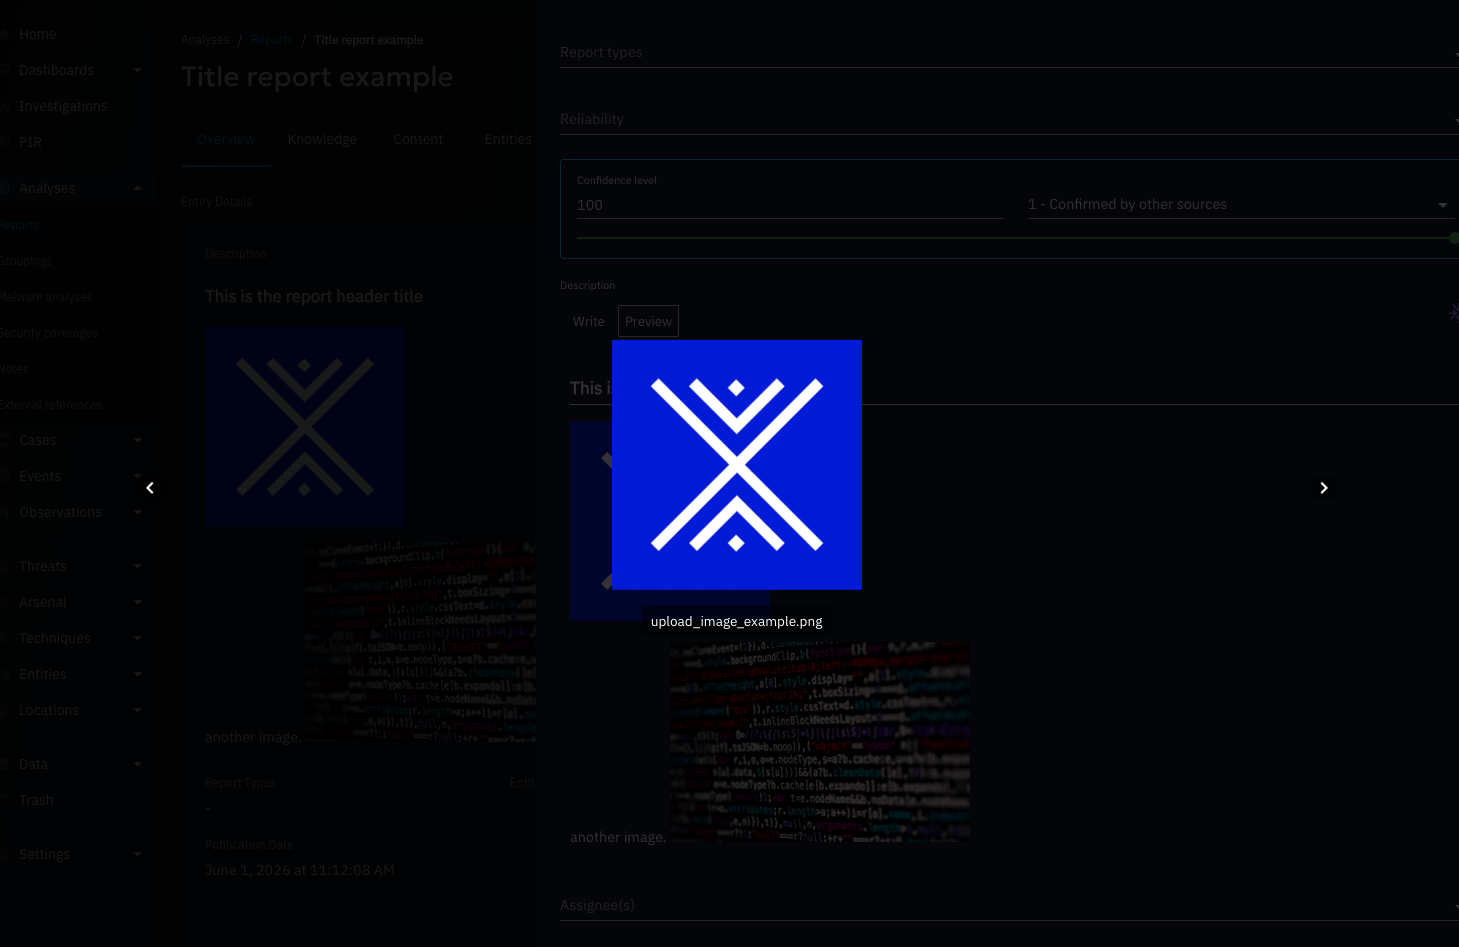
Image upload constraints
- SVG images are not supported.
- Image size must not exceed 5 MB.
Performance considerations
- There is no fixed limit on the number of images you can add in markdown content.
- Adding many images, or larger images, can increase processing time when saving content and during related export/import operations.
The Content mapping view and the Suggested mapping view are available for a subset of entities: Report, Grouping, Incident, Incident response, Request for Information, and Request for Takedown.
Content mapping view
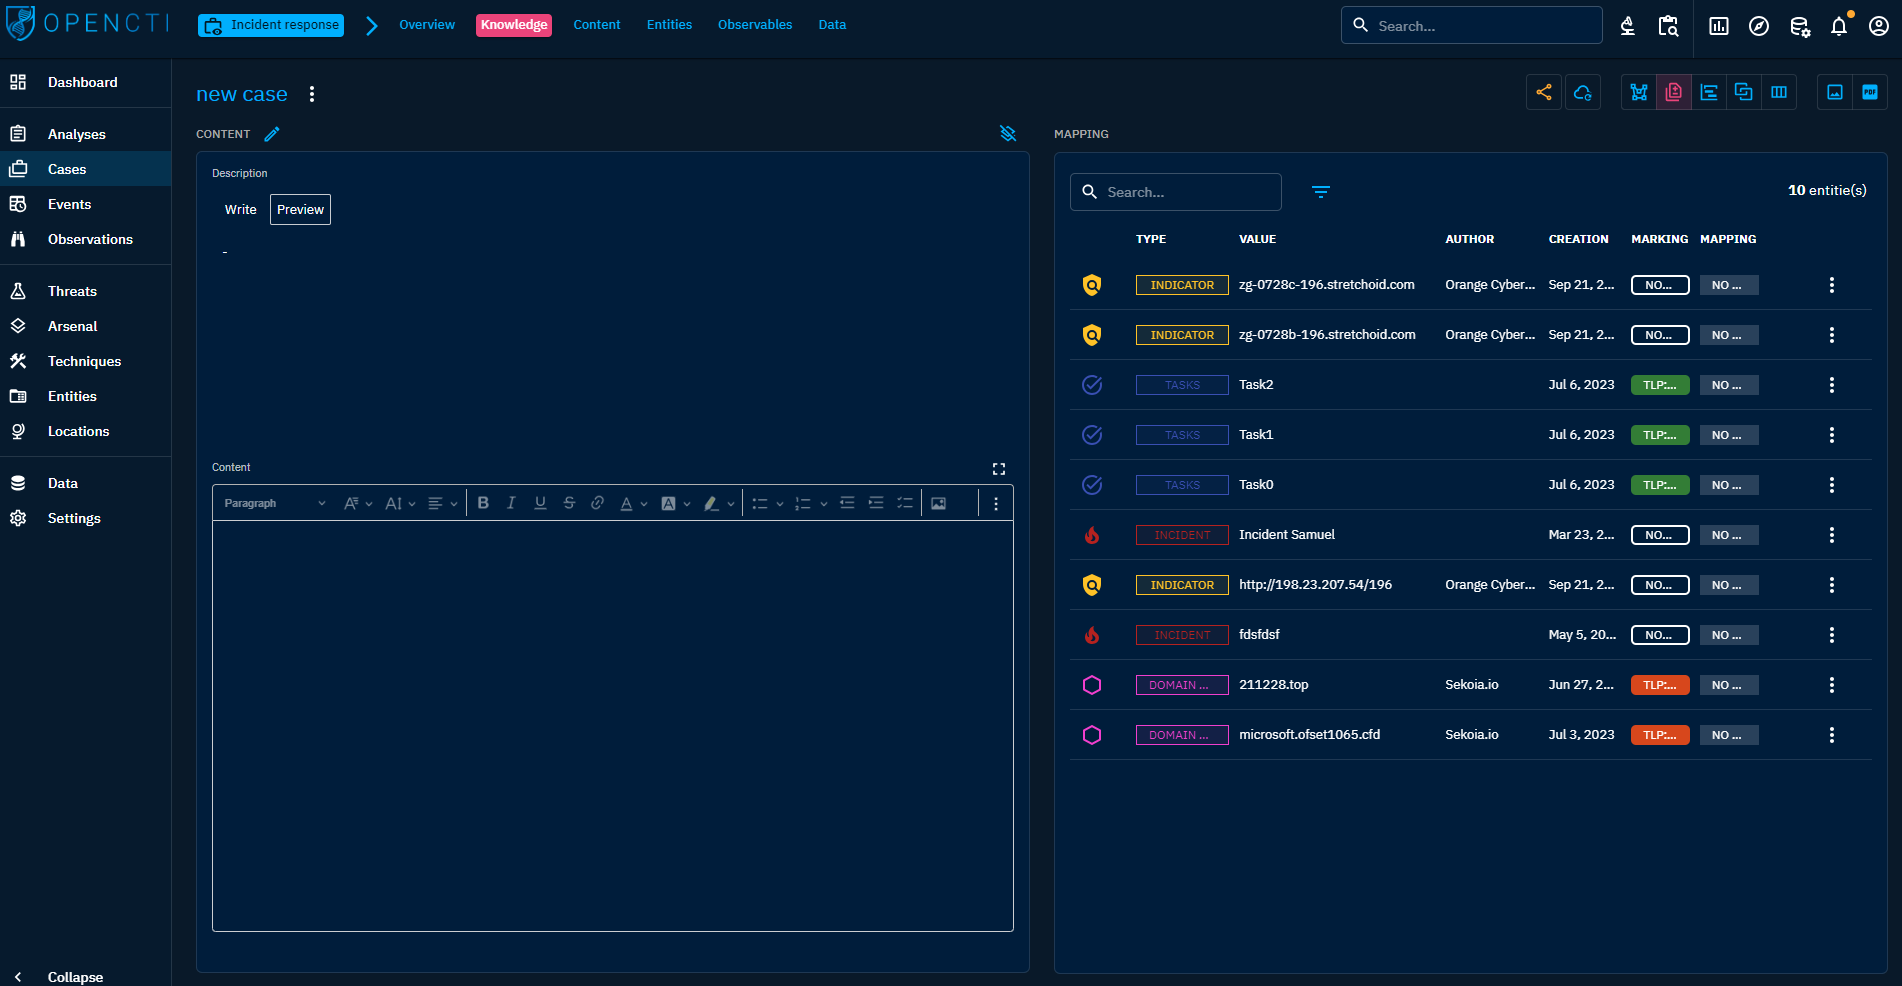
The Content mapping view displays the mappable content of your container on the left (Description and Content), and the objects contained in the container on the right.
This view allows you to map readable content to existing or new Objects by selecting text on the left. Mapping an object will add it to your container, and the object will then be displayed on the right.
You can clear all mappings that you added by clicking on the Clear mappings button. This action will only remove the mapping: the objects will still be contained in your container.
This allows you to quickly append structured Knowledge in your Case before refining it with relationships and details, and makes it a great place to see the continuum between unstructured and structured Knowledge.
Suggested mapping view
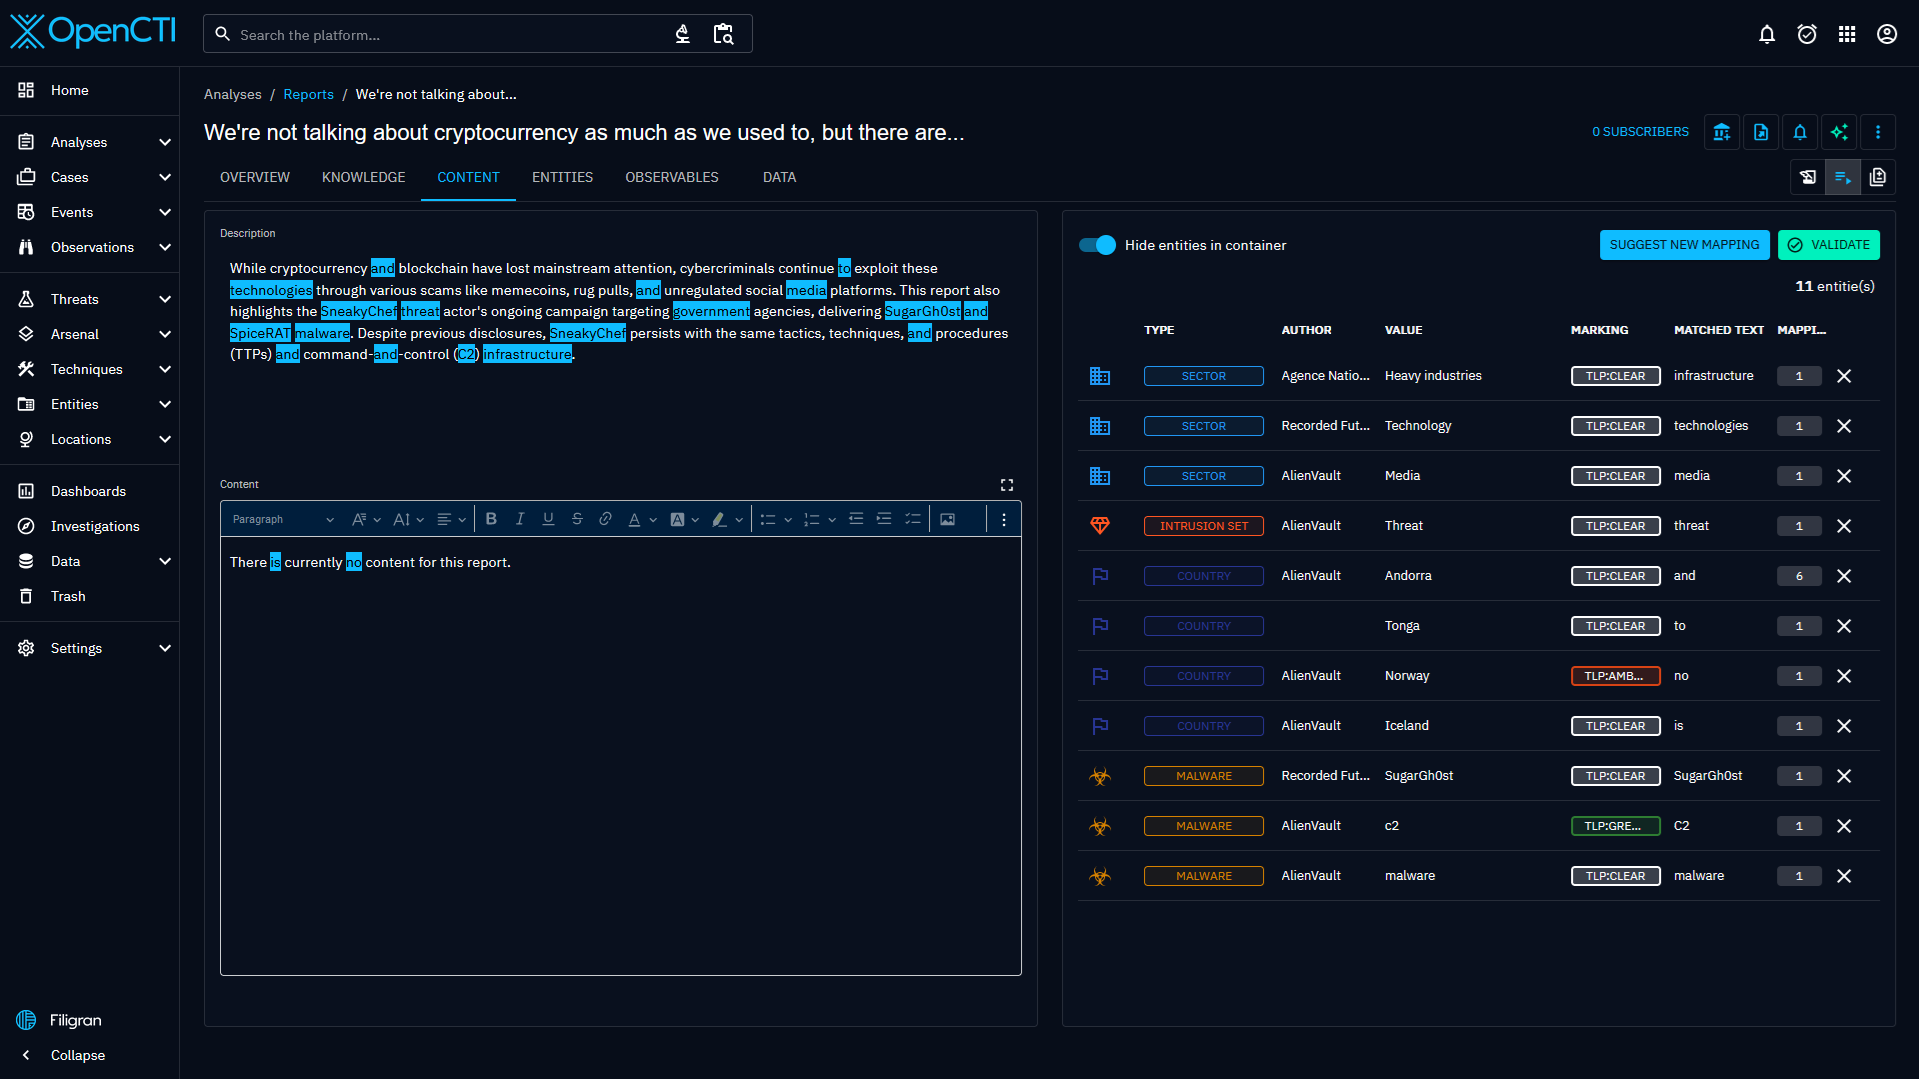
The Suggested mapping view displays the mappable content of your container on the left (Description and Content), and the suggested entity mapping on the right.
This view allows you to get a suggestion list of existing Objects based on your mappable content by clicking on Suggest new mapping.
To be able to get a suggestion, you need to have at least one analysis connector of type INTERNAL_ANALYSIS configured.
Once the suggestion has been computed by the connector, it will be available on the right.
You can the remove the suggestion that you are not interested in, and click on the Validate button to add the mapped objects to your container.
This allows you to quickly fill your Container with the data that you need, without having to manually map every related Objects.
Analyses
The Analyses tab contains the list of all Analyses (Report, Groupings) and Cases (Incident response, Request for Information, Request for Takedown) in which the entity has been identified.
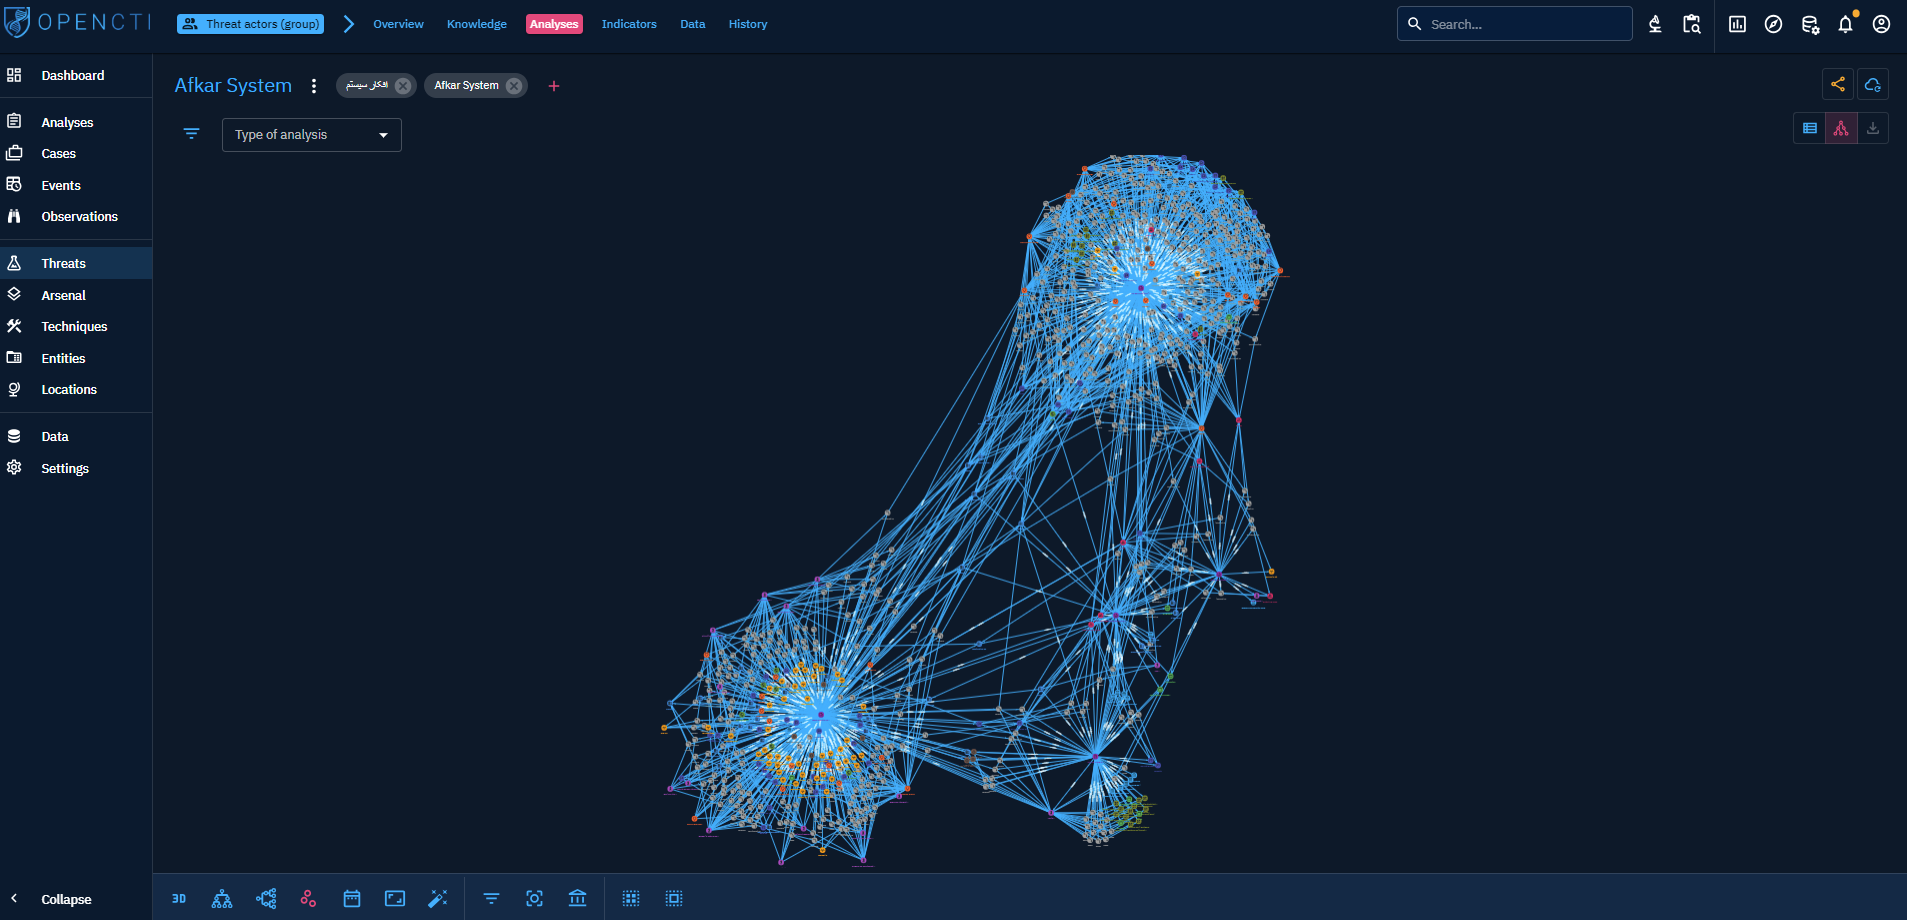
By default, this tab display the list, but you can also display the content of all the listed Analyses on a graph, allowing you to explore all their Knowledge and have a glance of the context around the Entity.
Data
The Data tab contains documents that are associated to the object and were either:
- Uploaded to the platform : for instance the PDF document containing the text of the report
- Generated from the platform to be downloaded : a JSON or CSV file containing information on the object and generated by the user.
- associated to an external reference
Analyst Workbench can also be created from here. They will contain the entity by default.

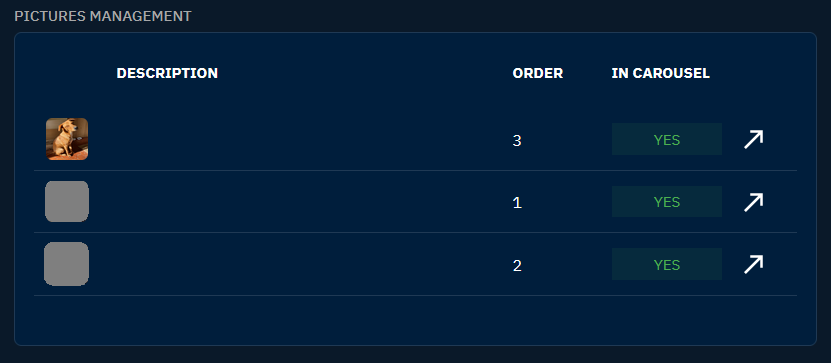
In addition, the Data tab of Threat actors (group), Threat actors (individual), Intrusions sets, Organizations, Individuals have an extra panel:
- Pictures Management: allows to manage the profile pictures attached to the entity.
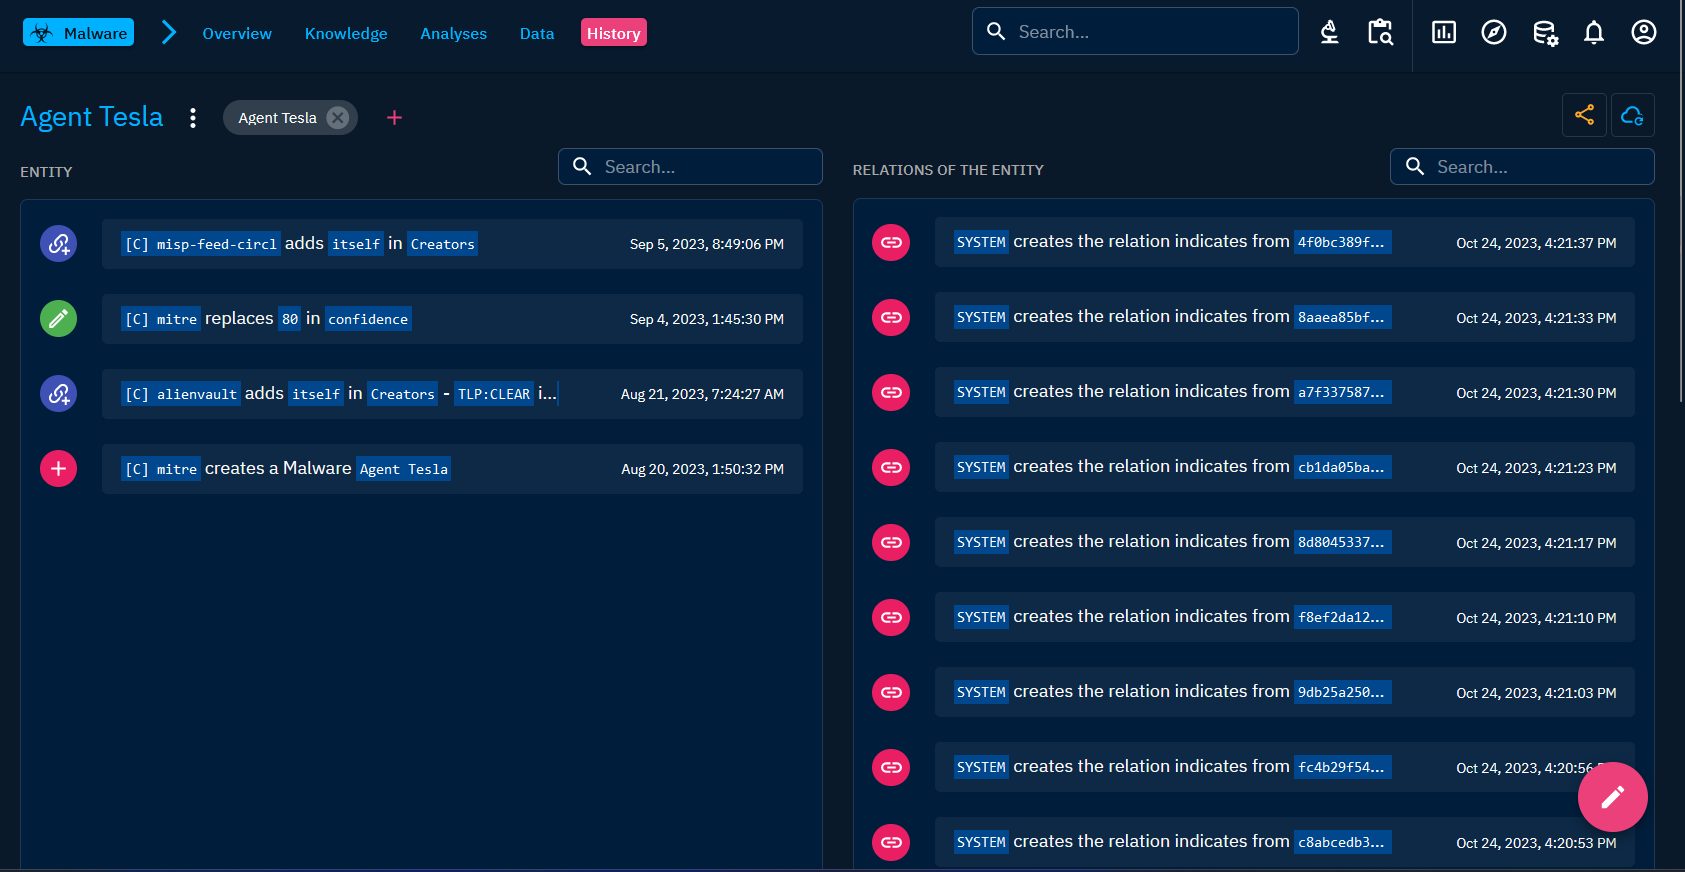
History
The History tab displays the history of change of the Entity, update of attributes, creation of relations, ...
Because of the volumes of information the history is written in a specific index that consume the redis stream to rebuild the history for the UI.
Less frequent tabs
- The
Observablestab (for Reports and Observed data): A table containing all SCO (Stix Cyber Observable) contained in the Report or the Observed data, with search and filters available. It also displays if the SCO has been added directly or through inferences with the reasoning engine - the
Entitiestab (for Reports and Observed data): A table containing all SDO (Stix Domain Objects) contained in the Report or the Observed data, with search and filters available. It also displays if the SDO has been added directly or through inferences with the reasoning engine - the
Sightingstab (for Indicators and Observables): A table containing allSightingsrelationships corresponding to events in whichIndicators(IP, domain name, URL, etc.) are detected by or within an information system, an individual or an organization. Most often, this corresponds to a security event transmitted by a SIEM or EDR.