Getting started
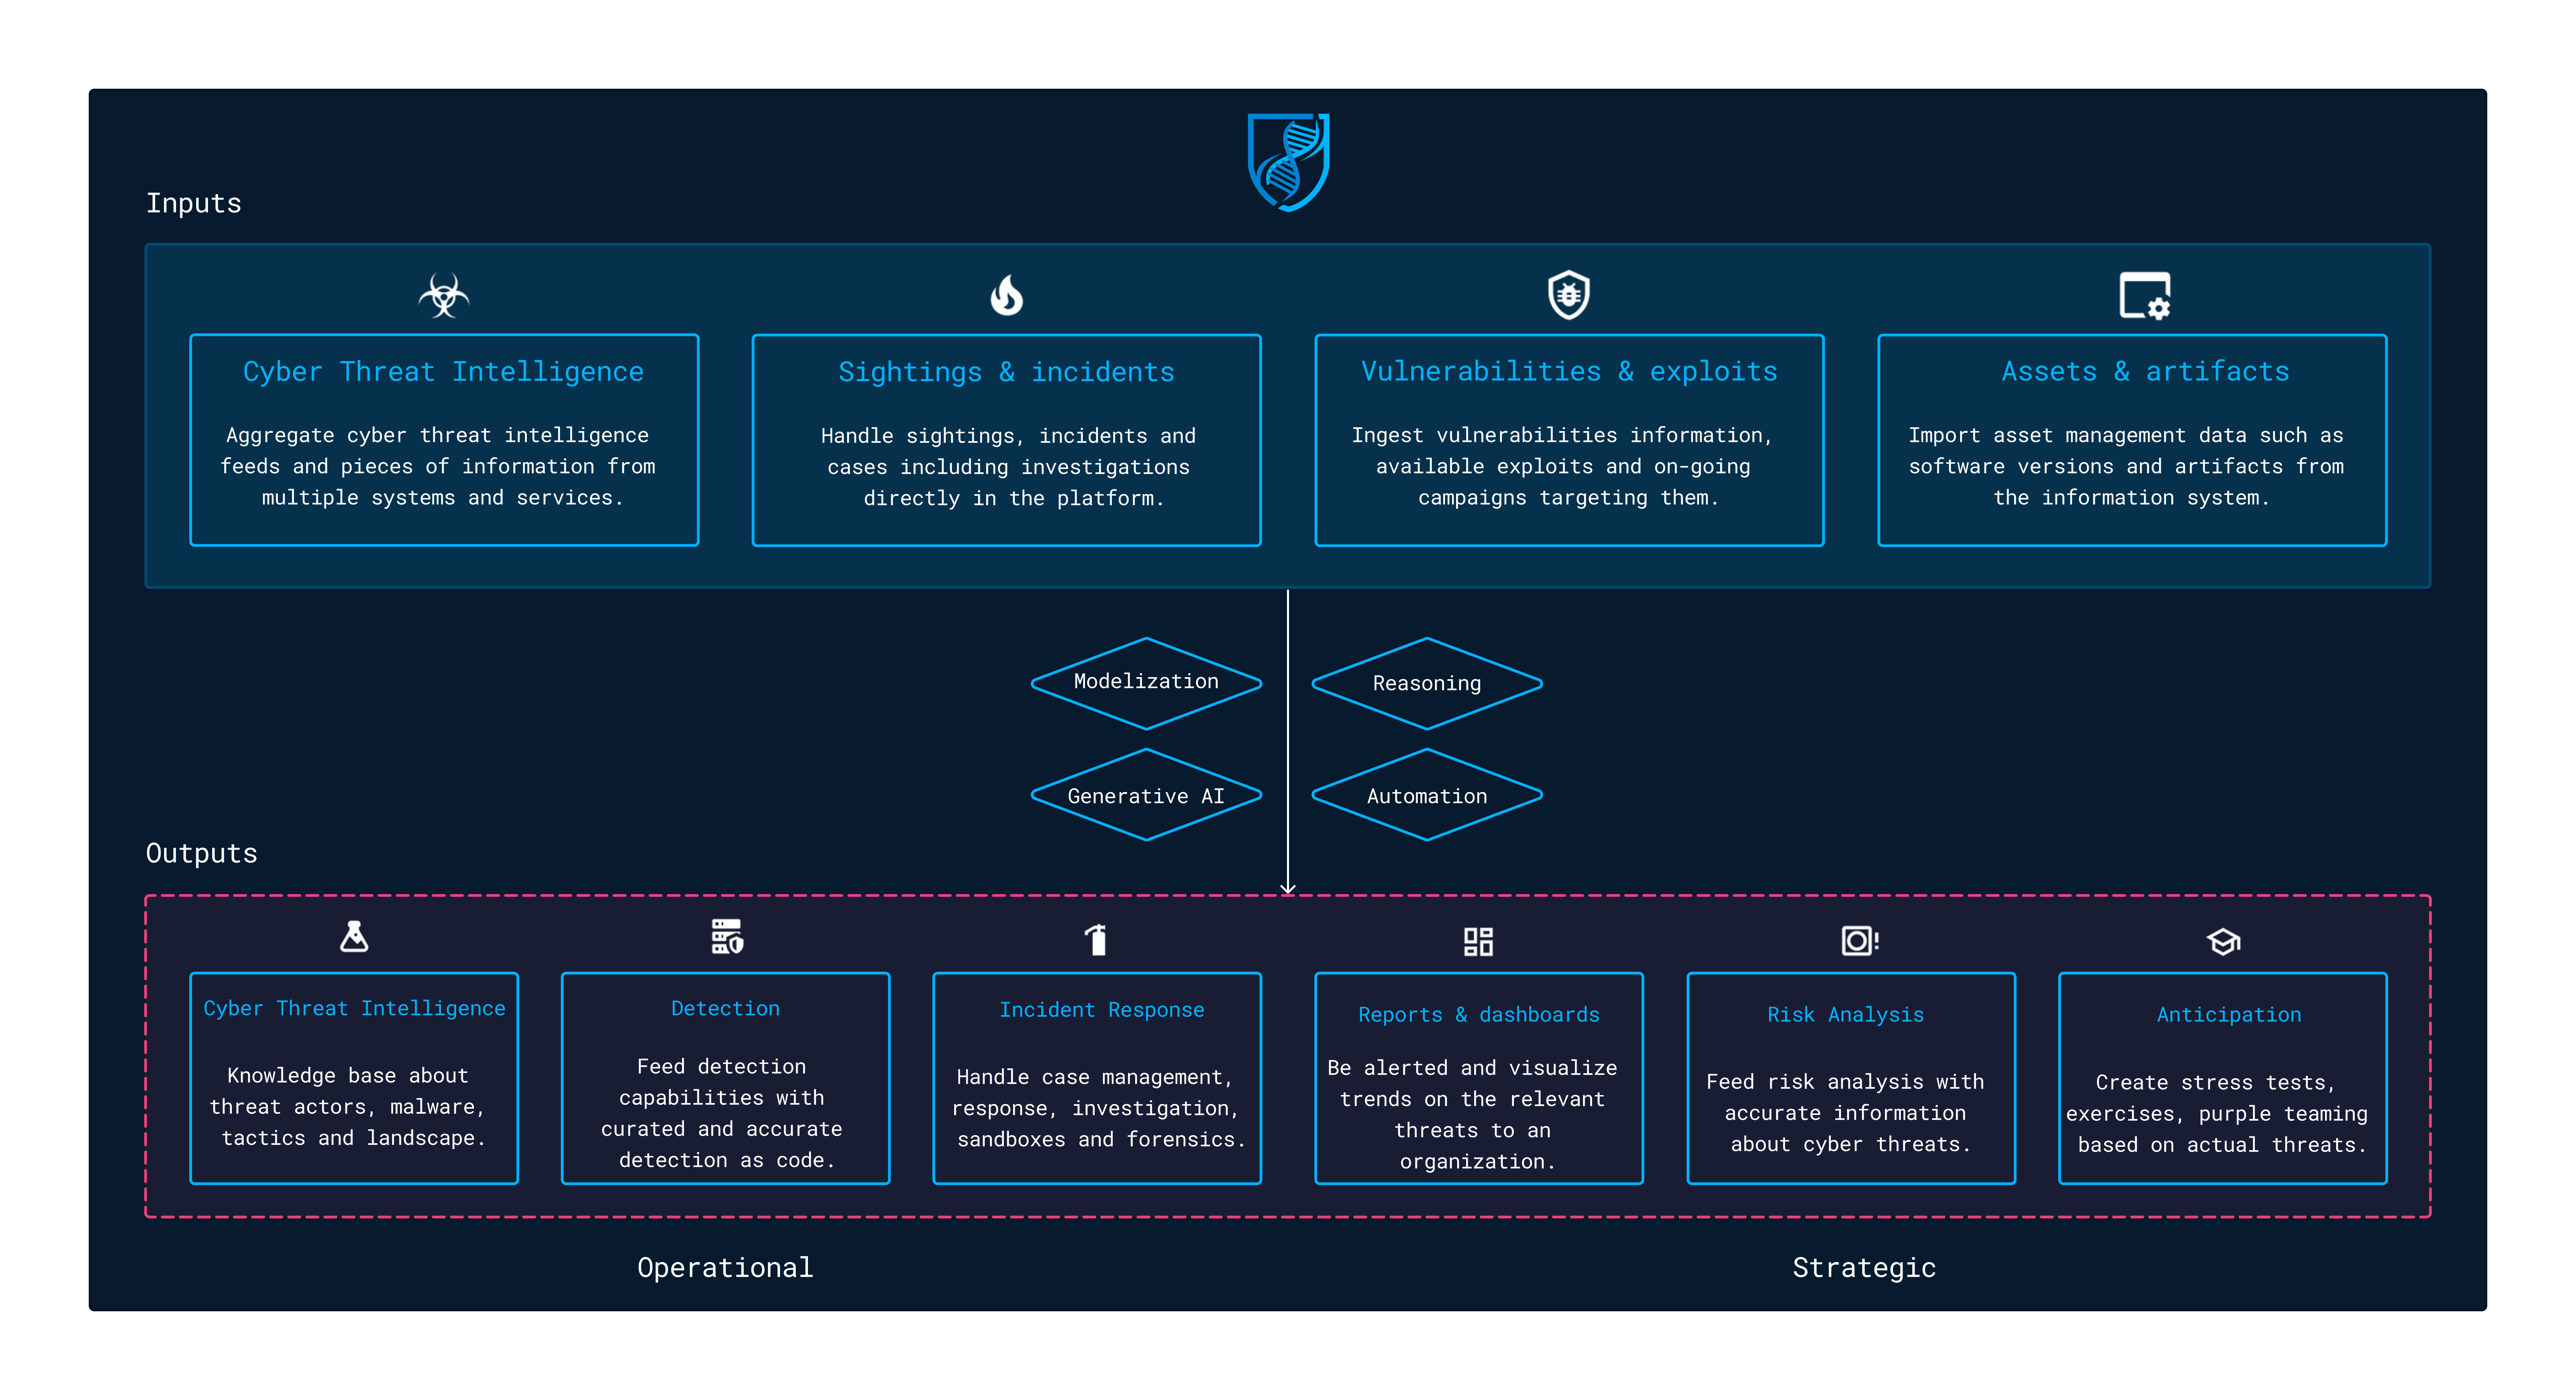
This guide aims to give you a full overview of the OpenCTI features and workflows. The platform can be used in various contexts to handle threats management use cases from a technical to a more strategic level. OpenCTI has been designed as a knowledge graph, taking inputs (threat intelligence feeds, sightings & alerts, vulnerabilities, assets, artifacts, etc.) and generating outputs based on built-in capabilities and / or connectors.
Here are some examples of use cases:
- Cyber Threat Intelligence knowledge base
- Detection as code feeds for XDR, EDR, SIEMs, firewalls, proxies, etc.
- Incident response artifacts & cases management
- Vulnerabilities management
- Reporting, alerting and dashboarding on a subset of data
Welcome dashboard
The welcome page gives any visitor on the OpenCTI platform an overview of what's happening on the platform. It can be replaced by a custom dashboard, created by a user (or the default dashboard set up in a role, a group or an organization).
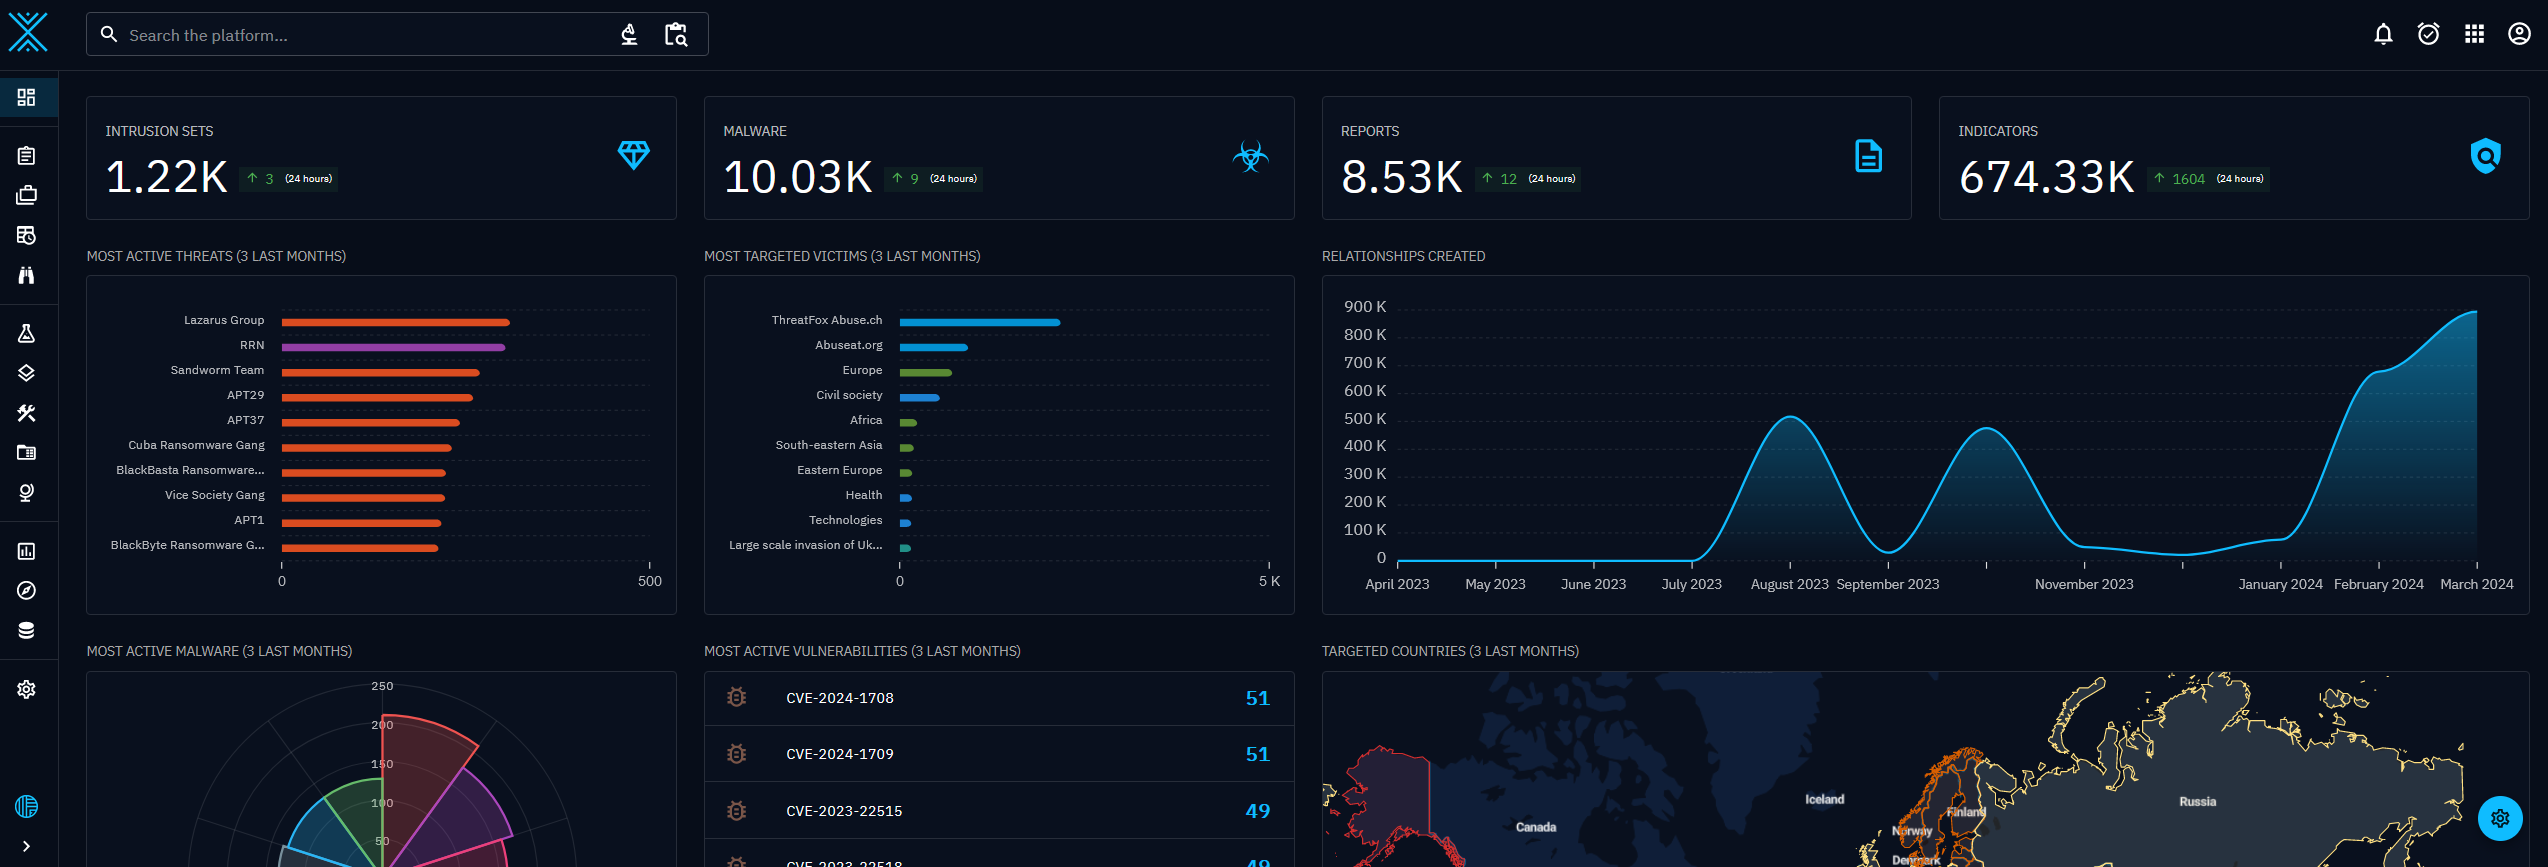
Indicators in the dashboard
Numbers
| Component | Description |
|---|---|
| Intrusion sets | Number of intrusion sets. |
| Malware | Number of malware. |
| Reports | Number of reports. |
| Indicators | Number of indicators. |
Charts & lists
| Component | Description |
|---|---|
| Most active threats (3 last months) | Top active threats (threat actor, intrusion set and campaign) during the last 3 months. |
| Most targeted victims (3 last months) | Intensity of the targeting tied to the number of relations targets for a given entities (organization, sector, location, etc.) during the last 3 months. |
| Relationships created | Volume of relationships created over the past 12 months. |
| Most active malware (3 last months) | Top active malware during the last 3 months. |
| Most active vulnerabilities (3 last months) | List of the vulnerabilities with the greatest number of relations over the last 3 months. |
| Targeted countries (3 last months) | Intensity of the targeting tied to the number of relations targets for a given country over the past 3 months. |
| Latest reports | Last reports ingested in the platform. |
| Most active labels (3 last months) | Top labels given to entities during the last 3 months. |
Explore the platform
To start exploring the platform and understand how information is structured, we recommend starting with the overview documentation page.