Observations
When you click on "Observations" in the left-side bar, you access all the "Observations" tabs, visible on the top bar on the left. By default, the user directly access the "Observables" tab, but can navigate to the other tabs as well.
From the Observations section, users can access the following tabs:
Observables: AnObservablerepresents an immutable object. Observables can encompass a wide range of entities such as IPv4 addresses, domain names, email addresses, and more.Artefacts: In OpenCTI, theArtefactsis a particular Observable. It may contain a file, such as a malware sample.Indicators: AnIndicatoris a detection object. It is defined by a search pattern, which could be expressed in various formats such as STIX, Sigma, YARA, among others.Infrastructures: AnInfrastructuredescribes any systems, software services and any associated physical or virtual resources intended to support some purpose (e.g. C2 servers used as part of an attack, devices or servers that are part of defense, database servers targeted by an attack, etc.).
Observables
General presentation
An Observable is a distinct entity from the Indicator within OpenCTI and represents an immutable object. Observables can encompass a wide range of entities such as IPv4 addresses, domain names, email addresses, and more. Importantly, Observables don't inherently imply malicious intent, they can include items like legitimate IP addresses or domains associated with an organization. Additionally, they serve as raw data points without the additional detection context found in Indicators.
When clicking on the Observables tab at the top left, you see the list of all the Observables you have access to, in respect with your allowed marking definitions.

Visualizing Knowledge associated with an Observable
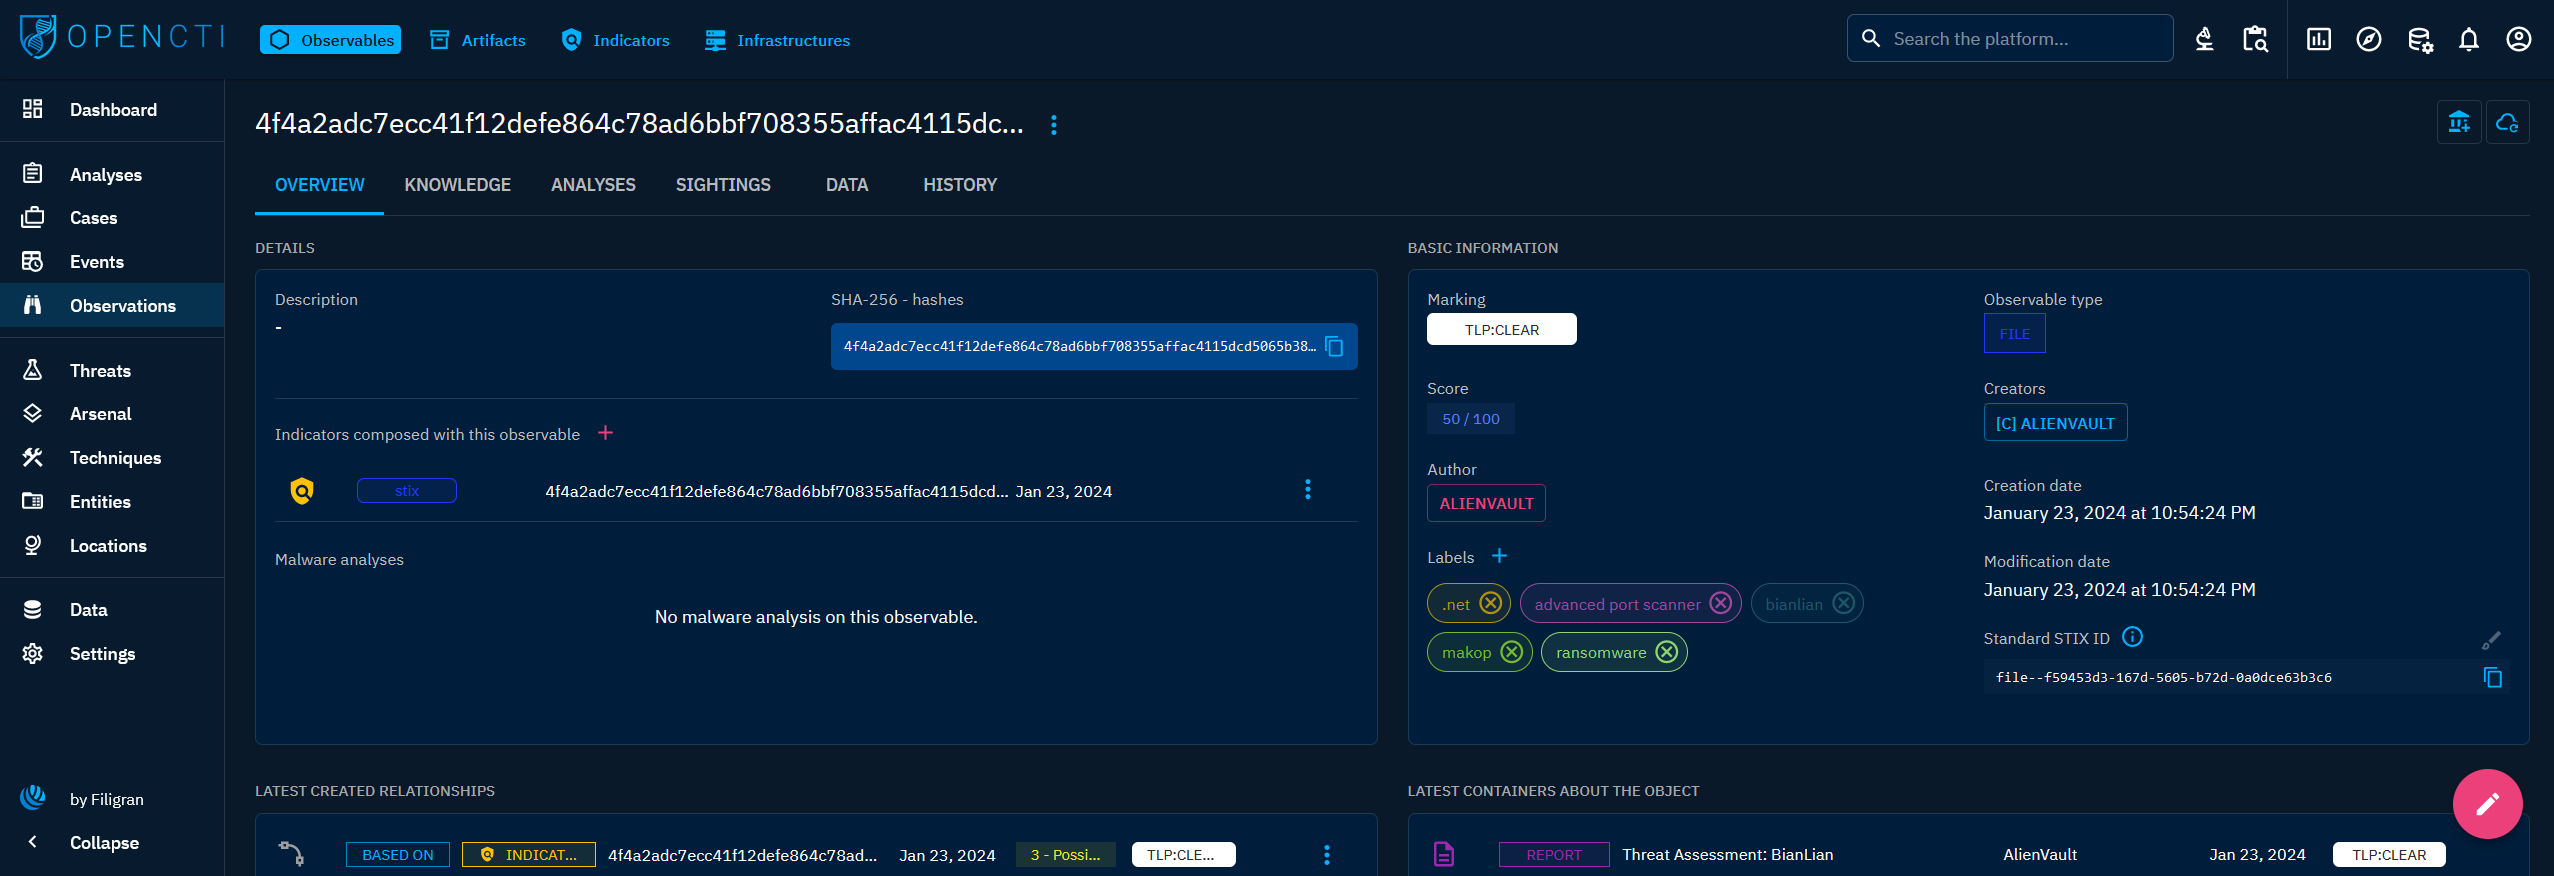
When clicking on an Observable in the list, you land on its Overview tab. For an Observable, the following tabs are accessible:
- Overview: as described here, with the particularity to display Indicators composed with the Observable.
- Knowledge: a tab listing all its relationships and nested objects.
- Content: This specific tab allows to previzualize, manage and write deliverable associated with the Observation. For example an analytic report to share with other teams, a markdown files to feed a collaborative wiki with, etc. As described here.
- Analyses: as described here.
- Sightings: a table containing all
Sightingsrelationships corresponding to events in which theObservable(IP, domain name, url, etc.) has been sighted. - Data: as described here.
- History: as described here.
Artefacts
General presentation
An Artefact is a particular Observable. It may contain a file, such as a malware sample. Files can be uploaded or downloaded in encrypted archives, providing an additional layer of security against potential manipulation of malicious payloads.
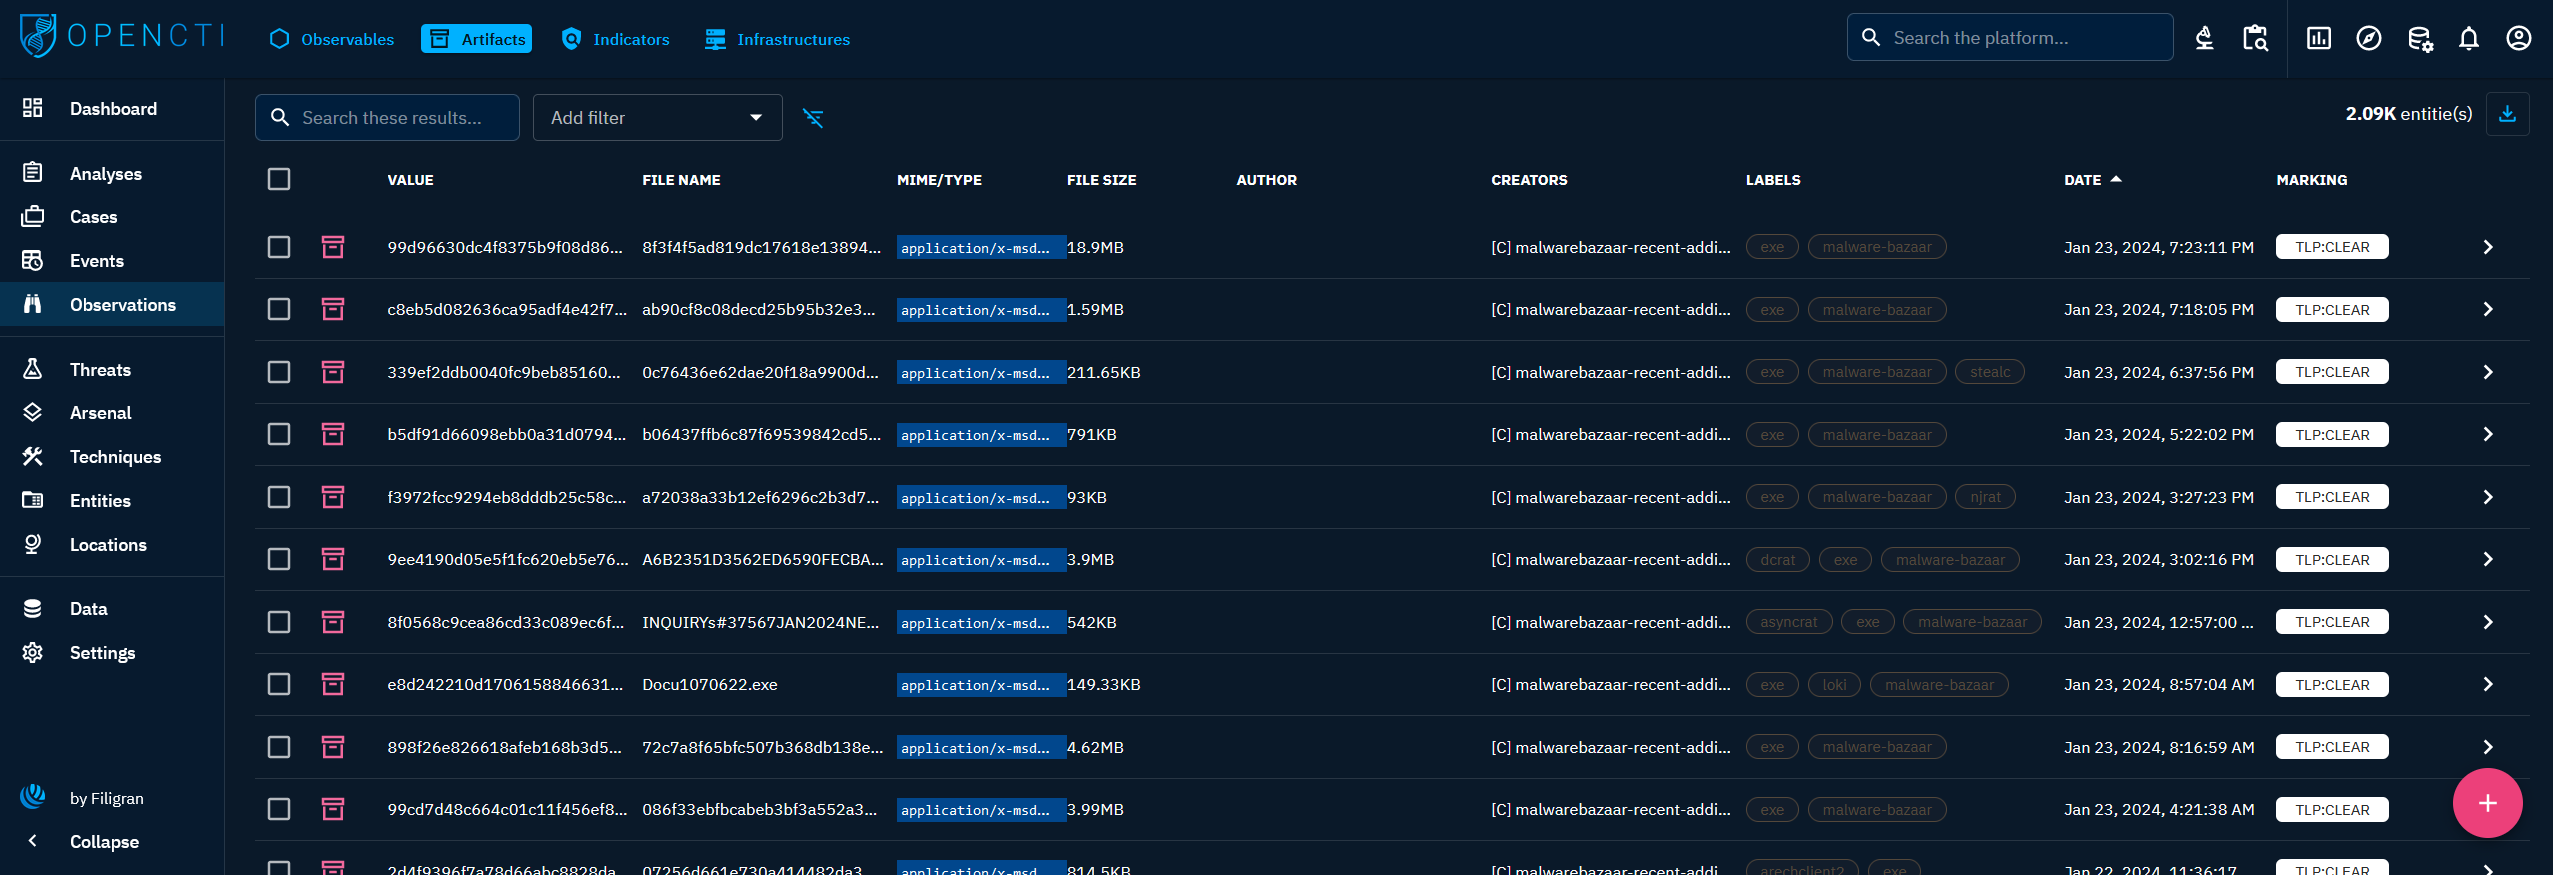
When clicking on the Artefacts tab at the top left, you see the list of all the Artefacts you have access to, in respect with your allowed marking definitions.
Visualizing Knowledge associated with an Artefact
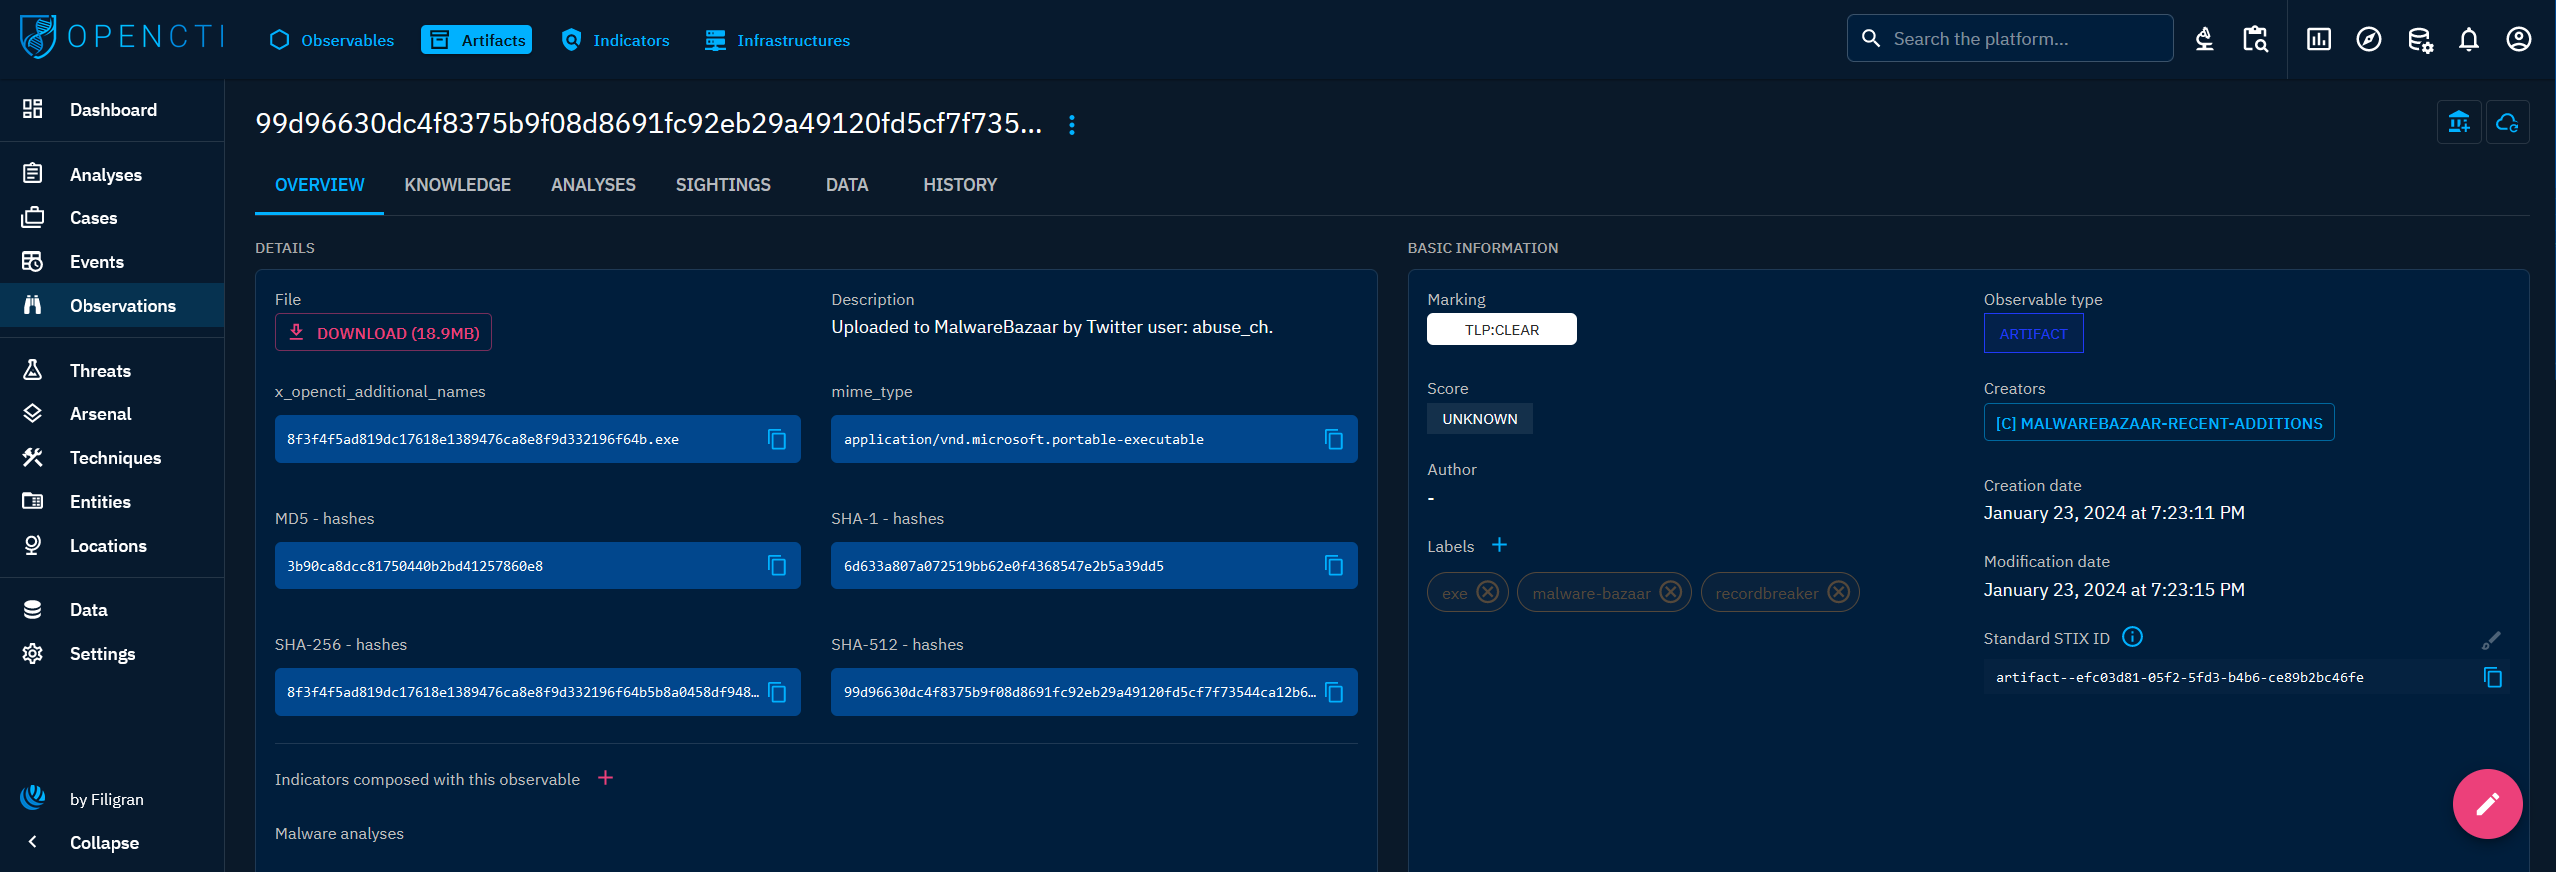
When clicking on an Artefact in the list, you land on its Overview tab. For an Artefact, the following tabs are accessible:
- Overview: as described here, with the particularity to be able to download the attached file.
- Knowledge: a tab listing all its relationships and nested objects.
- Content: This specific tab allows to previzualize, manage and write deliverable associated with the Artefact. For example an analytic report to share with other teams, a markdown files to feed a collaborative wiki with, etc. As described here.
- Analyses: as described here.
- Sightings: a table containing all
Sightingsrelationships corresponding to events in which theArtefacthas been sighted. - Data: as described here.
- History: as described here.
Indicators
General presentation
An Indicator is a detection object. It is defined by a search pattern, which could be expressed in various formats such as STIX, Sigma, YARA, among others. This pattern serves as a key to identify potential threats within the data. Furthermore, an Indicator includes additional information that enriches its detection context. This information encompasses:
- Validity dates: Indicators are accompanied by a time frame, specifying the duration of their relevance, and modeled by the
Valid fromandValid untildates. - Actionable fields: Linked to the validity dates, the
RevokedandDetectionfields can be used to sort Indicators for detection purposes. - Kill chain phase: They indicate the phase within the cyber kill chain where they are applicable, offering insights into the progression of a potential threat.
- Types: Indicators are categorized based on their nature, aiding in classification and analysis.
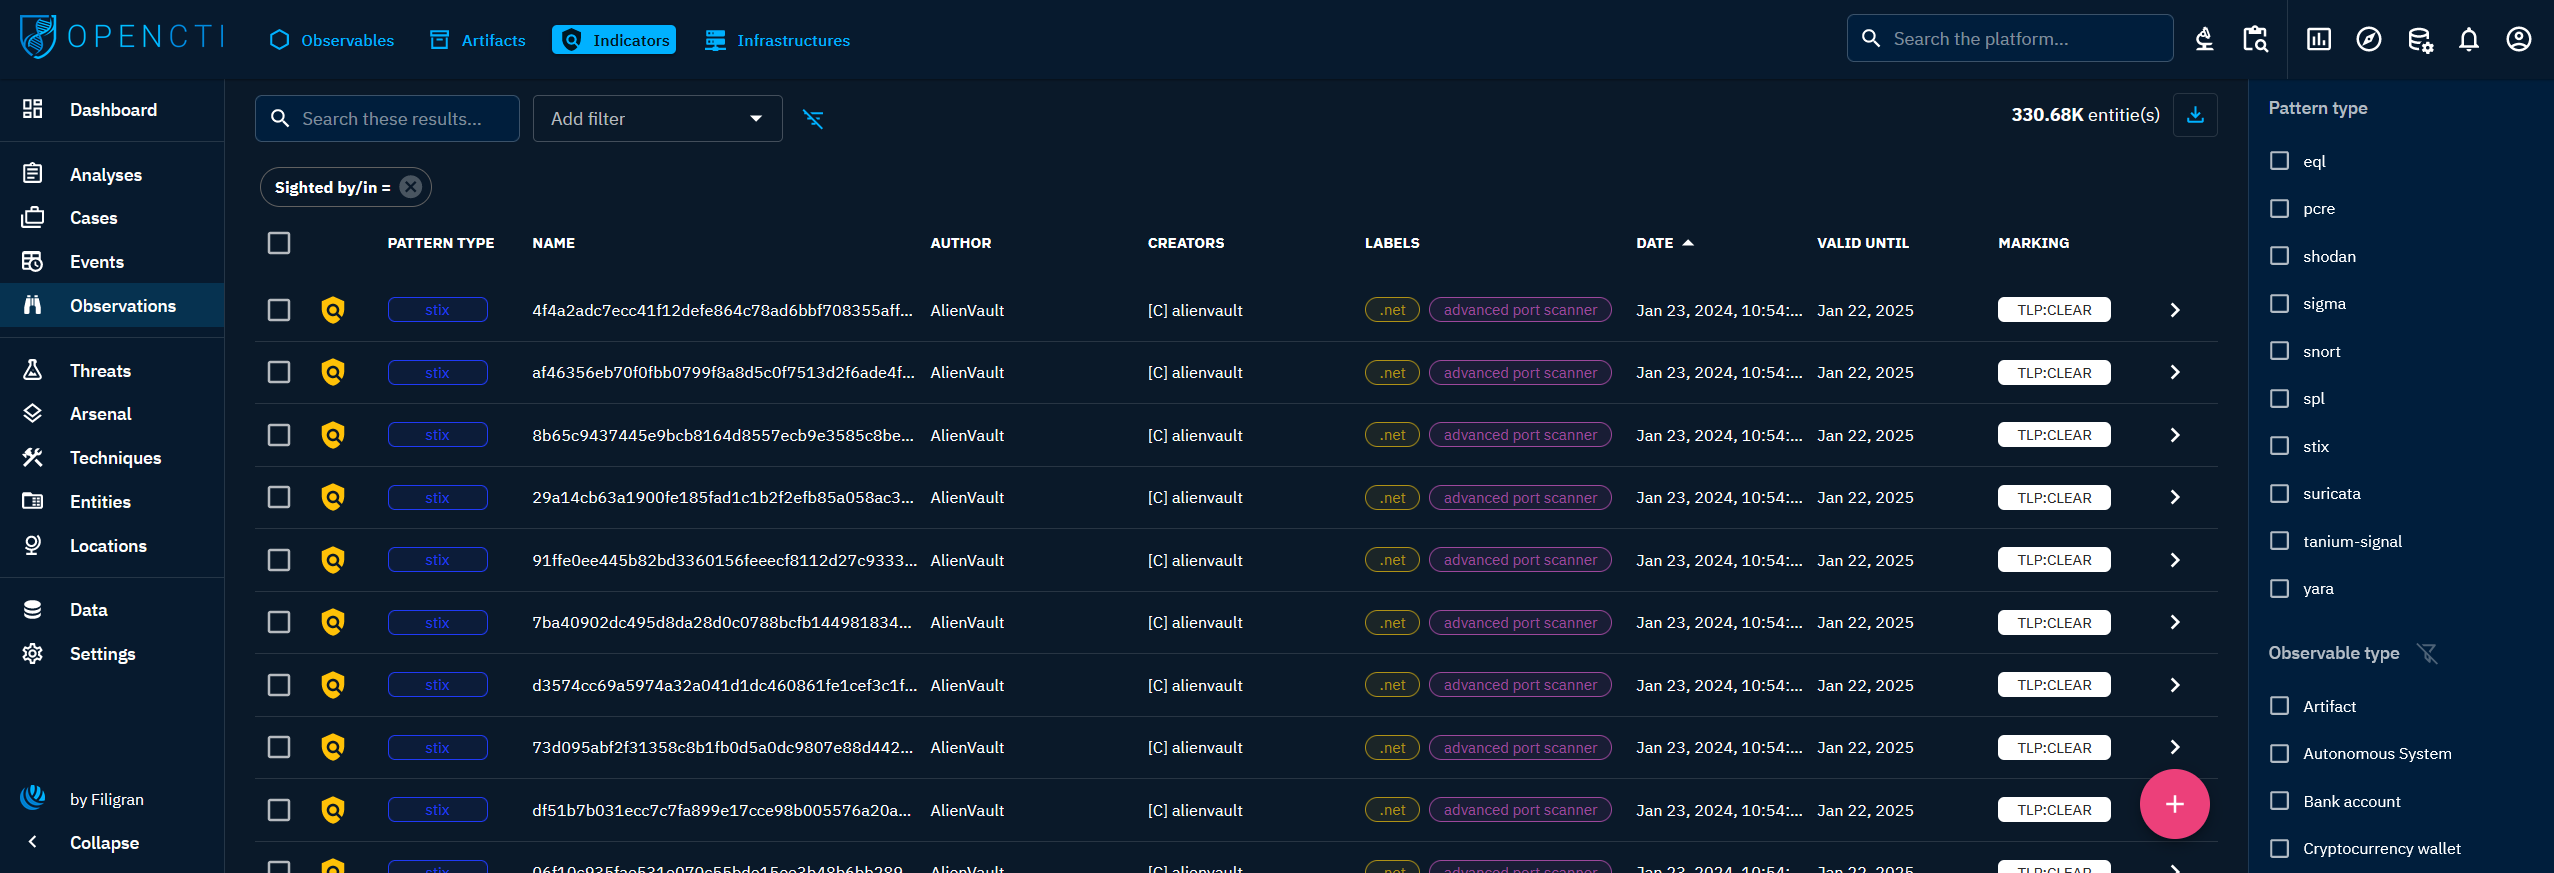
When clicking on the Indicators tab at the top left, you see the list of all the Indicators you have access to, in respect with your allowed marking definitions.
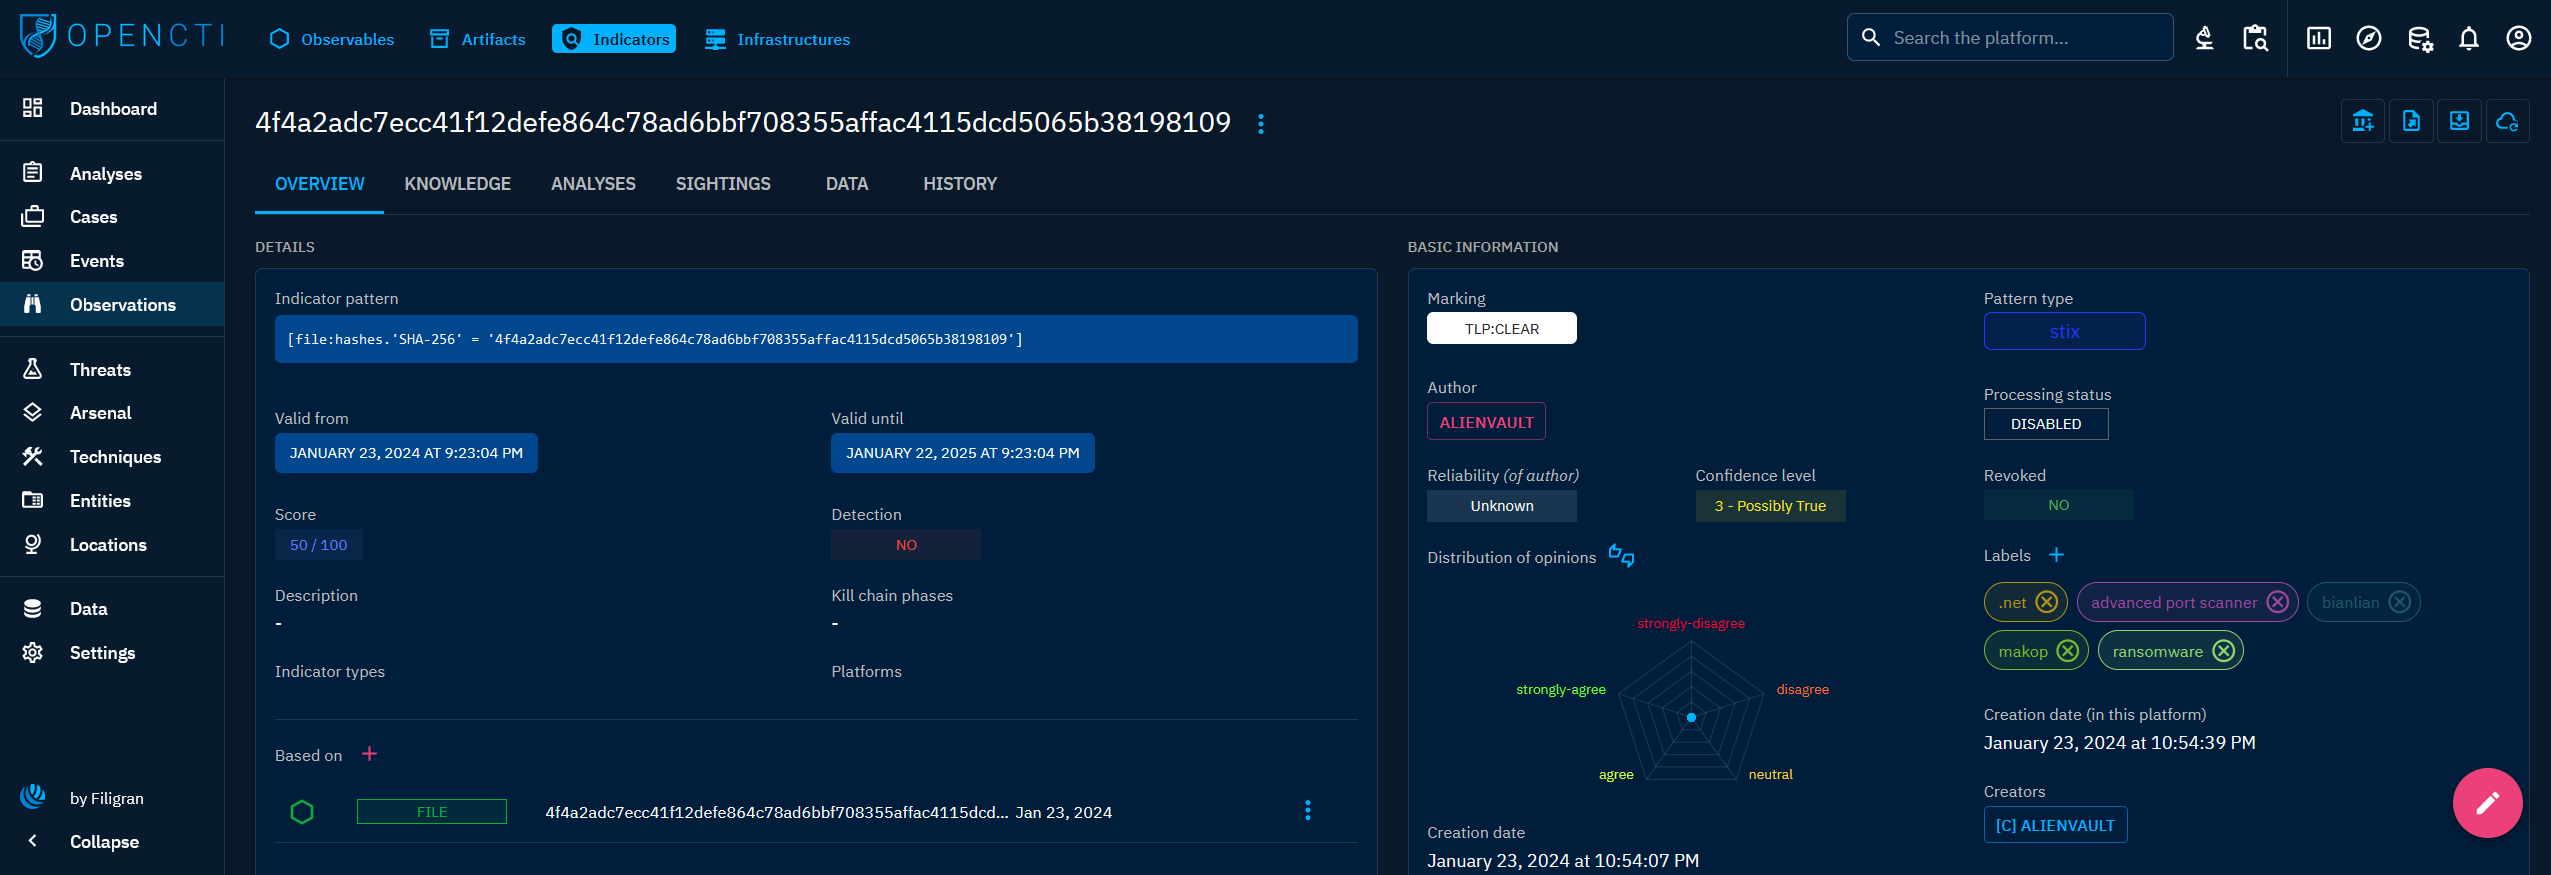
Visualizing Knowledge associated with an Indicator
When clicking on an Indicator in the list, you land on its Overview tab. For an Indicator, the following tabs are accessible:
- Overview: as described here, with the particularity to display the Observables on which it is based.
- Knowledge: a tab listing all its relationships.
- Content: This specific tab allows to previzualize, manage and write deliverable associated with the Indicator. For example an analytic report to share with other teams, a markdown files to feed a collaborative wiki with, etc. As described here.
- Analyses: as described here.
- Sightings: a table containing all
Sightingsrelationships corresponding to events in which theIndicatorhas been sighted. - Data: as described here.
- History: as described here.
Infrastructures
General presentation
An Infrastructure refers to a set of resources, tools, systems, or services employed by a threat to conduct their activities. It represents the underlying framework or support system that facilitates malicious operations, such as the command and control (C2) servers in an attack. Notably, like Observables, an Infrastructure doesn't inherently imply malicious intent. It can also represent legitimate resources affiliated with an organization (e.g. devices or servers that are part of defense, database servers targeted by an attack, etc.).
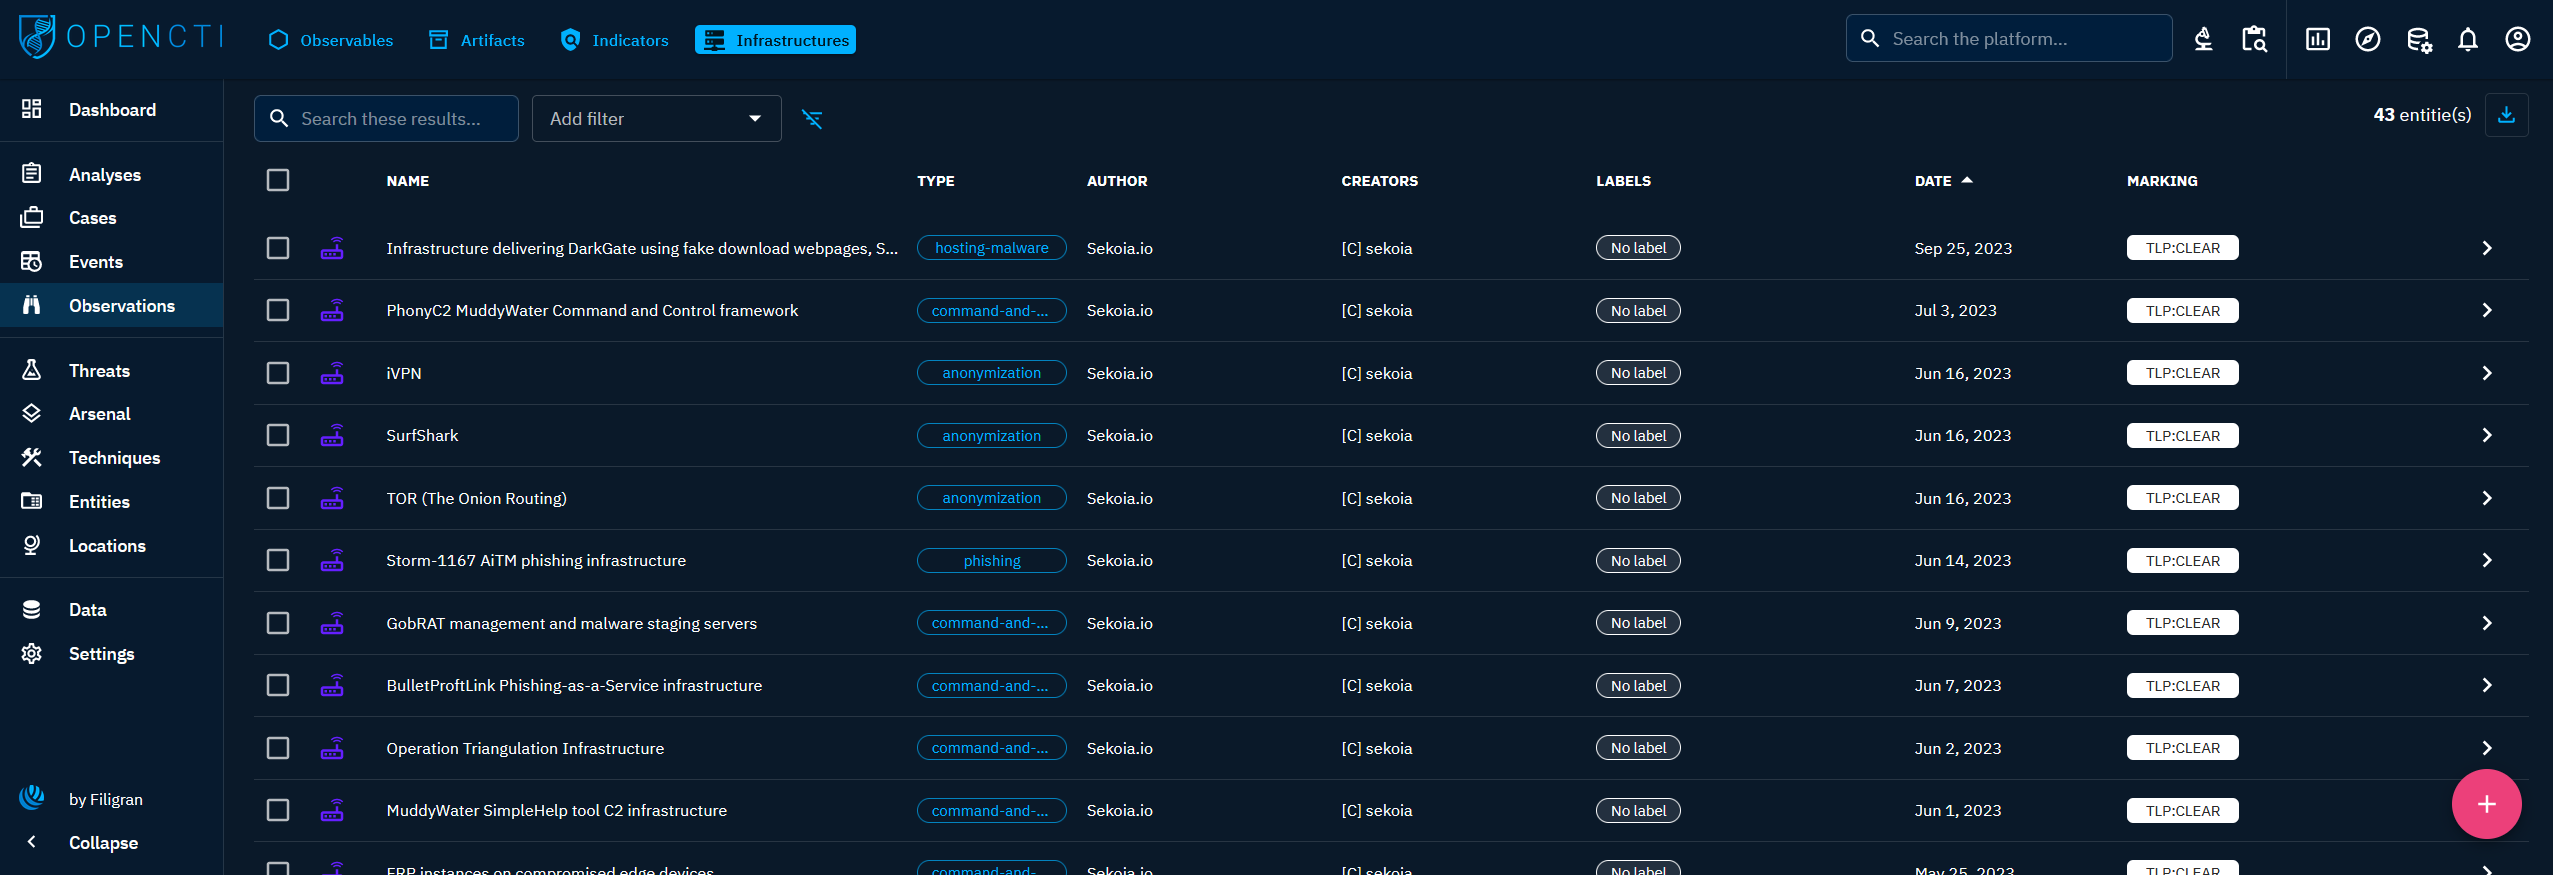
When clicking on the Infrastructures tab at the top left, you see the list of all the Infrastructures you have access to, in respect with your allowed marking definitions.
Visualizing Knowledge associated with an Infrastructure
When clicking on an Infrastructure in the list, you land on its Overview tab. For an Infrastructure, the following tabs are accessible:
- Overview: as described here, with the particularity to display distribution graphs of its related Observable (STIX SCO).
- Knowledge: a complex tab that regroups all the structured Knowledge linked to the Infrastructure. Different thematic views are proposed to easily see the threats, the arsenal, the observations, etc. linked to the Infrastructure. As described here.
- Content: This specific tab allows to previzualize, manage and write deliverable associated with the Infrastructure. For example an analytic report to share with other teams, a markdown files to feed a collaborative wiki with, etc. As described here.
- Analyses: as described here.
- Data: as described here.
- History: as described here.